 |
eVision Python API
|
|
eVision Python API
|
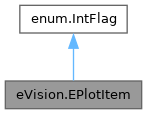
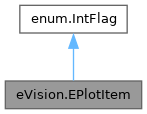
Defines how the profile is drawed across a gauge. More...
Static Public Attributes | |
| int | Transitions = 1 |
| Displays the profile along a point location gauge. | |
| int | Peak = 2 |
| Displays the corresponding derivative curve. | |
| int | Thresholds = 4 |
| Displays the threshold and minimum amplitude levels. | |
| int | Points = 8 |
| Displays the valid transitions. | |
Defines how the profile is drawed across a gauge.
|
static |
Displays the corresponding derivative curve.
|
static |
Displays the valid transitions.
Must be called alongside or after eVision.EPlotItem.Transitions or eVision.EPlotItem.Peak.
|
static |
Displays the threshold and minimum amplitude levels.
|
static |
Displays the profile along a point location gauge.
 1.17.0