Navigating the Interface
The Main Interface
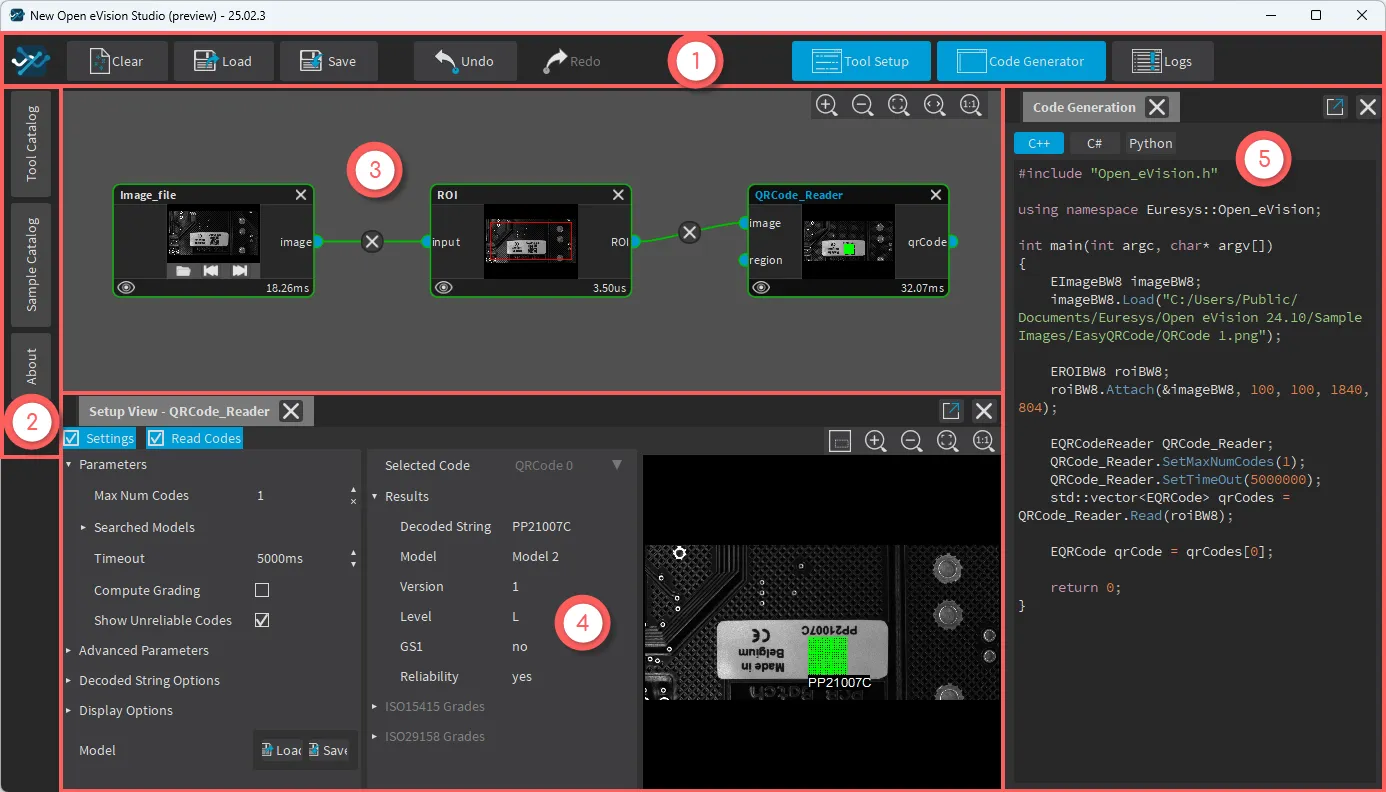
The project buttons:
Clear,LoadandSave.The
UndoandRedobuttons.The additional pane buttons:
Tool Setup,Code GeneratorandLogs(see below).
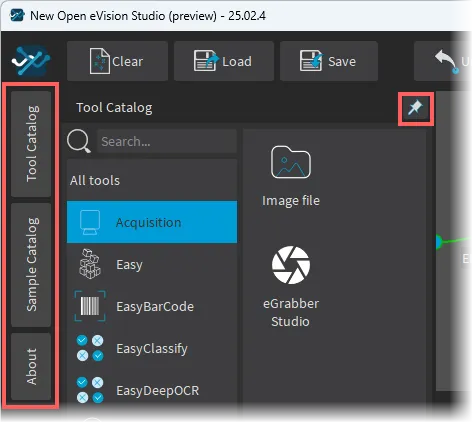
The
Tool Catalog.The
Sample Catalog.The
Aboutbox.Open a pane and click on the
 in the top right corner to lock / unlock it.
The main view of your current application.
A setting pane.
A result pane.
A view of the tool result or output.
Such as the
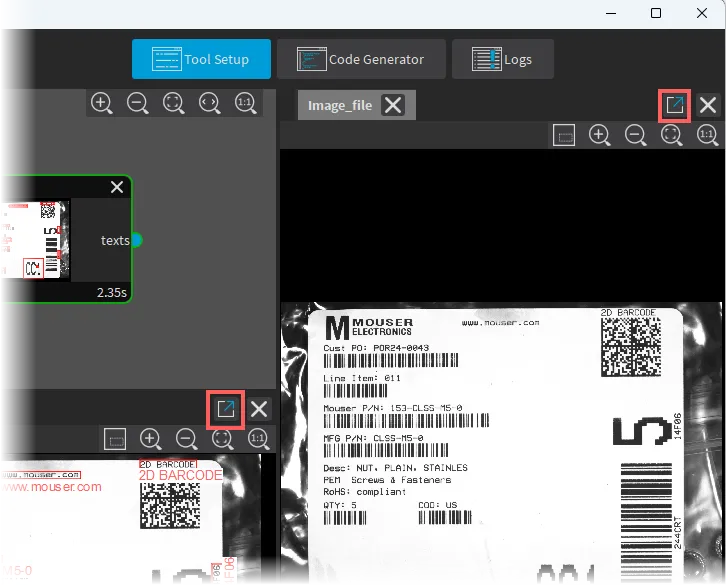
Code Generator,Logsand image panes of the toolsClick on the
 in the top right corner to detach it.
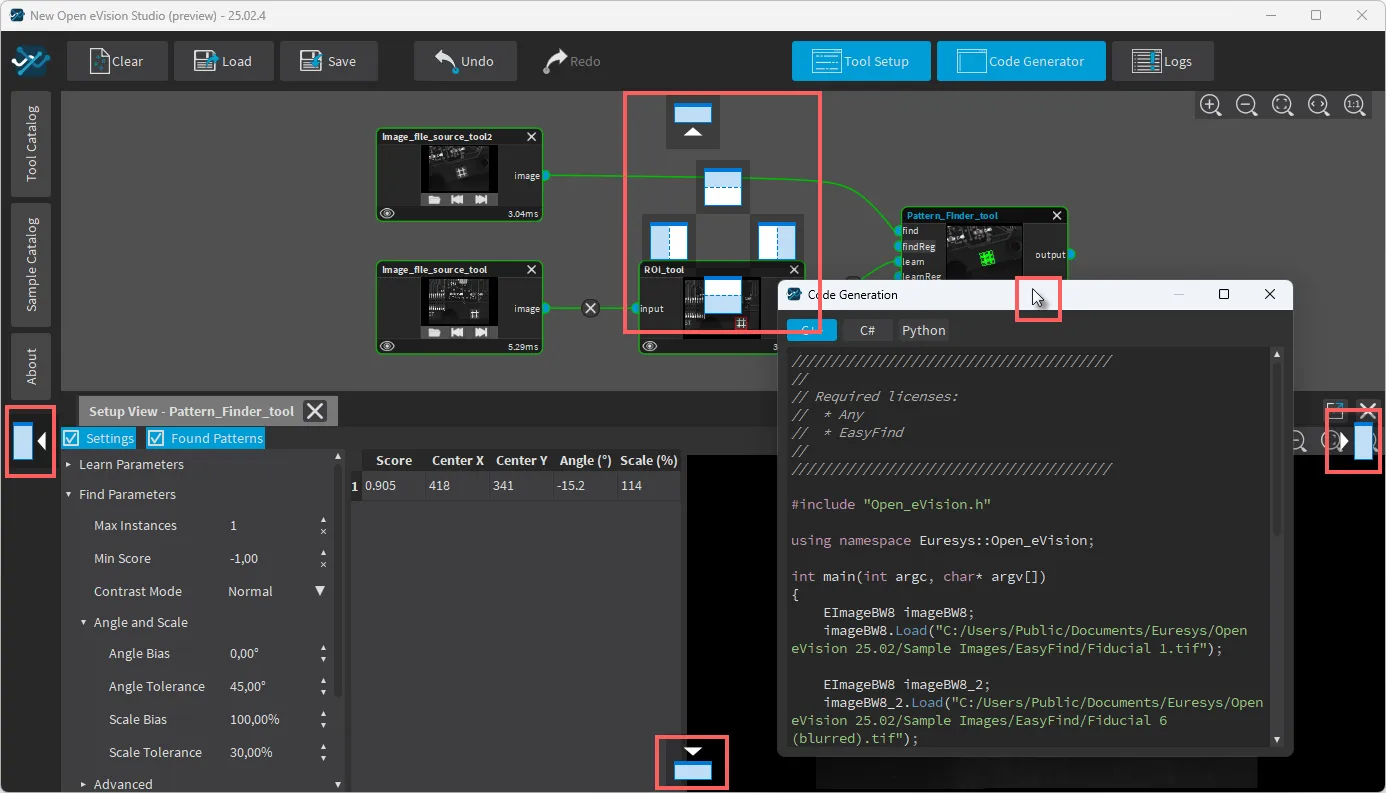
Drag it on one of the docking places, to dock it again.
See also
For details about the image panes, see Displaying Images.
Hint
You can organize your interface by moving and/or locking several panes:
The Tool Catalog
Navigate the Tool Catalog to select your tools, add them to the work space and create graphs.
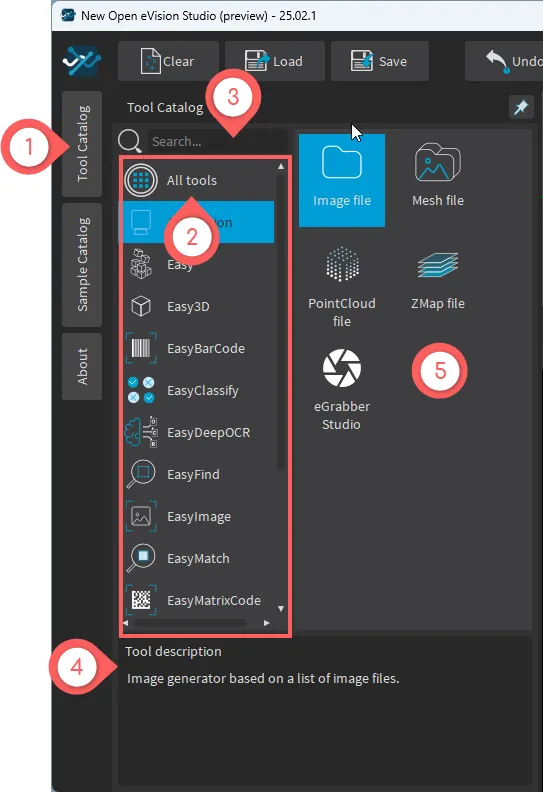
Tool Catalog in the left menu:Will open the
Tool Catalogview.You can now Navigate the catalog.
Will apply the selected filter to the tool list.
You can also select
All toolsfor a complete list of all the available tools.
Searching for a tool by its name:Will apply the filtering in real time while typing.
Will display a short description. :columns: 12
Will add it to the ‘work space’.
Hint
Open the All tools category for a complete search as the search is only performed in the selected category (that is only among the currently displayed tools).
The Work Space
Warning
The tools are automatically and dynamically arranged on the work space, you cannot move them around manually.
The Main Space
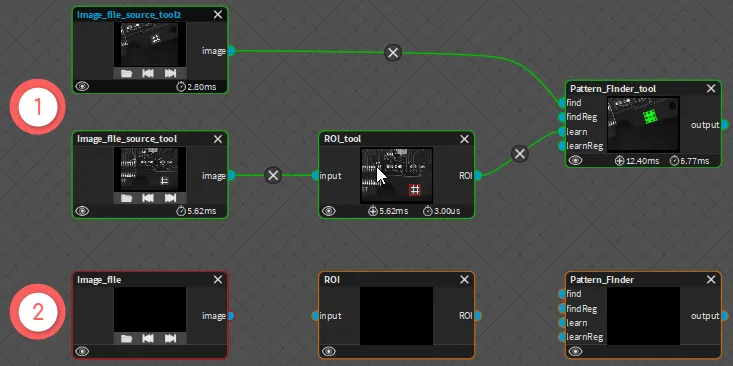
Made of linked tools.
Arranged and displayed in the upper part of the work space.
Arranged on a line in the lower part of the work space.
The Zoom
To control the zoom of the graph display, use the buttons in the top right corner of the work space:
 : zoom in (up to the 1:1 size).
 : zoom out.
 : resize to display the whole graph (up to the 1:1 size).
 : resize to use the whole work space width (up to the 1:1 size).
 : zoom the 1:1 size.
The Tools
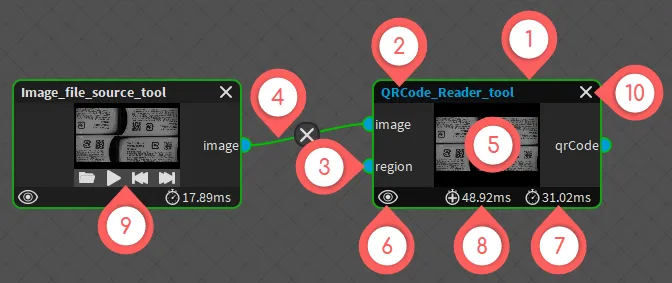
Green: the tool is operational.
Orange: the tool cannot be processed (most often because it is missing an input).
Red: the tool is in error and the propagation is stopped at this tool and cannot go further.
Click on it to edit and change it.
Blue: this is the “selected” tool whose
Setup Viewis currently open and displayed.
Click on an input port of a tool and an output port of another tool to connect them.
An output port can be connected to multiple tools.
Green: the link has a type (defined either manually or automatically according to the connected ports and tools).
Orange: the link has no type (yet).
Will open and display its
Setup View.
Will open the image in an additional view pane.
This additional view pane stays open even when you select another tool.
This duration is automatically updated with each processing.
This duration is automatically updated with each processing
To open an image.
To loop through a series of images.
See also
For more details, see Step 2: Opening Images.
Will remove it from the
work space.
The Sample Catalog
Navigate the Sample Catalog to open, test and edit ready-to-use sample graphs.
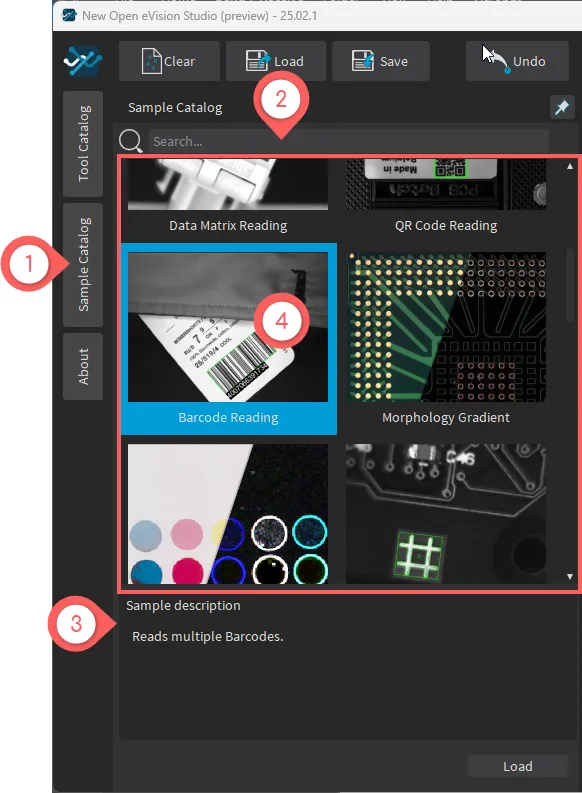
Sample Catalog in the left menu:Will open the
Sample Catalogview.You can now Navigate the catalog.
Searching for a sample by its name:Will apply the filtering in real time while typing.
Will display a short description. :columns: 12
Will add it to the ‘work space’.