Computing and Using Image Statistics
EasyImage provides multiple ways of extracting and computing statistics from an image. These returned statistics can either be:
Another image, this is the case for statistics that are expressed through filtering.
One or more values, this is the case when computing the maximum or minimum pixel values for example.
Sliding Window
The average and standard deviation of gray-level values can be computed in a sliding window, that is, computed for every position of a rectangular window centered on every pixel. The window size is arbitrary.
Note
The computing time of these functions does not depend on the window size.
The result of the operation is another image.
The local average,
EasyImage::LocalAverage.NET Python, corresponds to a strong low-pass filtering.
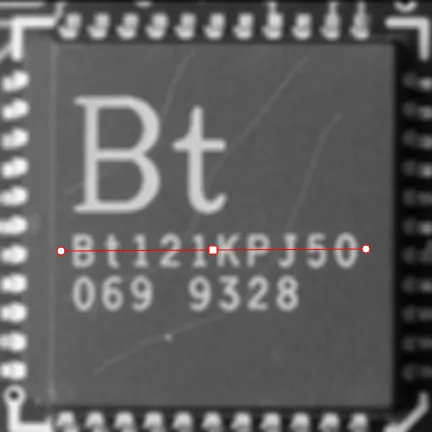
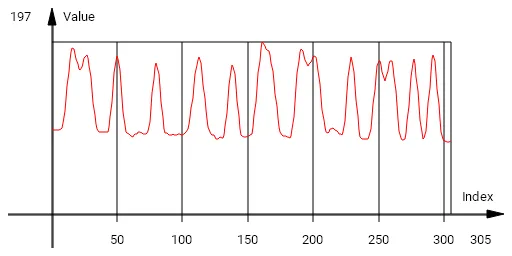
Sliding window average.
The local standard deviation,
EasyImage::LocalDeviation.NET Python enhances the regions with a high frequency contents, such as noisy or textured areas.
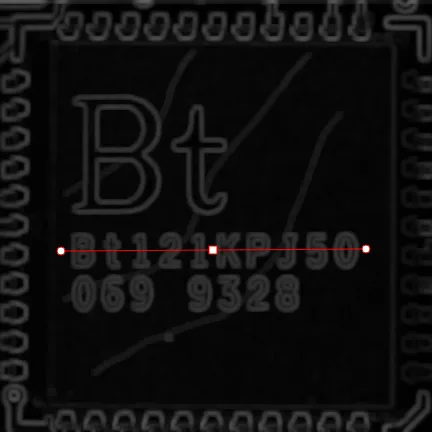
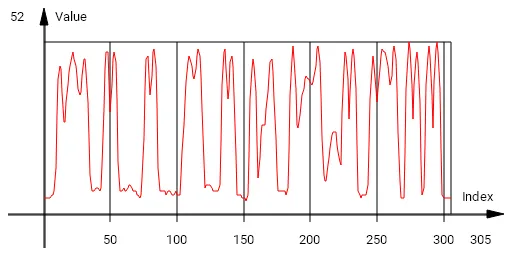
Sliding window standard deviation.
Histogram Computation and Analysis (and LUT Creation)
A histogram is a statistical summary of an image: it shows the number of occurrences for every gray-level value in an image, and its shape reveals characteristics of the image. For instance, peaks in the histogram curve correspond to dominant colors in the image. If the histogram is bi-modal, a large peak for the dark values corresponding to the background, and smaller peaks in the light values.
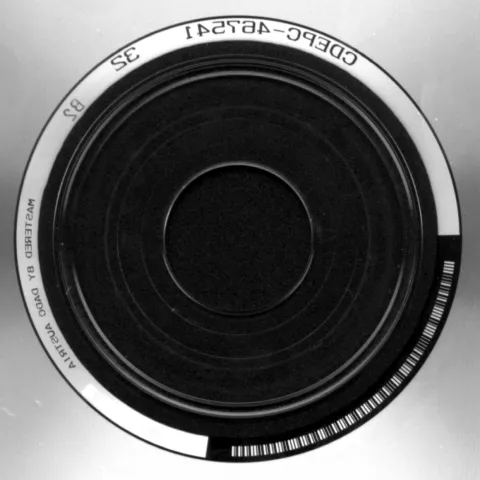
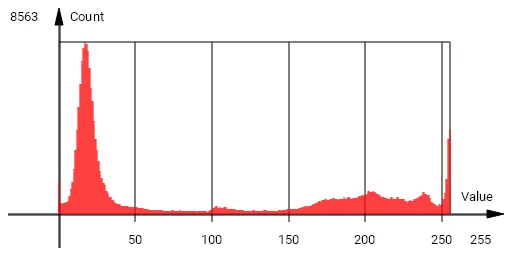
Typical image histogram.
Histogram Computation
EasyImage::Histogram.NET Python computes the histogram of an image. AERegionor a mask (using a binaryEImageBW8.NET Python) can be used to reduce or more precisely define the calculation area of the histogram.You can compute the cumulative histogram of an image, i.e. the count of pixels below a given threshold value, by calling
EasyImage::CumulateHistogram.NET Python afterEasyImage::Histogram.NET Python.
Histogram Analysis
EasyImage::AnalyseHistogram.NET Python andEasyImage::AnalyseHistogramBW16.NET Python allows to operate on a computed histogram. Multiple operations are available and are defined usingeVision::EHistogramFeature.NET PythonTotal number of pixels, using
eVision::EHistogramFeature_PixelCount.Smallest and largest pixel value (gray-level range), using
eVision::EHistogramFeature_SmallestPixelValue.NET Python andeVision::EHistogramFeature_GreatestPixelValue.NET Python.Average and standard deviation of the pixel values, using
eVision::EHistogramFeature_AveragePixelValue.NET Python andeVision::EHistogramFeature_PixelValueStdDev.NET Python.Value and frequency of the most frequent pixel, using
eVision::EHistogramFeature_MostFrequentPixelValue.NET Python andeVision::EHistogramFeature_MostFrequentPixelFrequency.NET Python.Value and frequency of the least frequent pixel, using
eVision::EHistogramFeature_LeastFrequentPixelValue.NET Python andeVision::EHistogramFeature_LeastFrequentPixelFrequency.NET Python.
Histogram Equalization
EasyImage::Equalize.NET Python re-maps the gray levels so that the histogram fills in the whole dynamic range as uniformly as possible.This may be useful to maximize image contrast, or to reveal details in dark parts of the image.
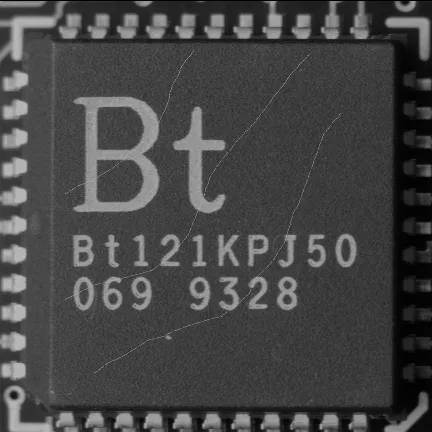
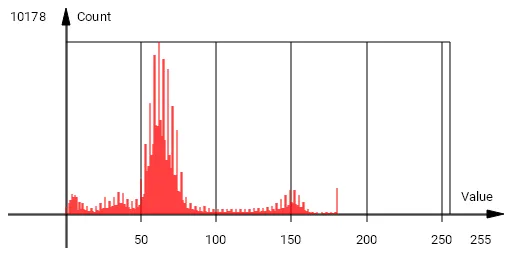
Input image and its histogram.
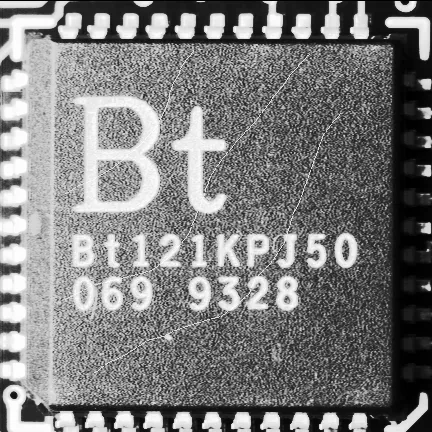
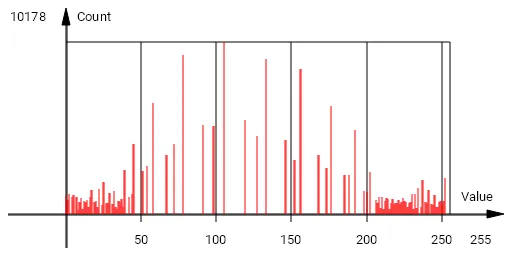
Equalized image and its histogram.
Set Up a Lookup Table
EasyImage::SetupEqualize.NET Python prepares a lookup-table for image equalization, using an image histogram. To apply the equalization,EasyImage::Lut().NET Python should be called afterward with the returned histogram.
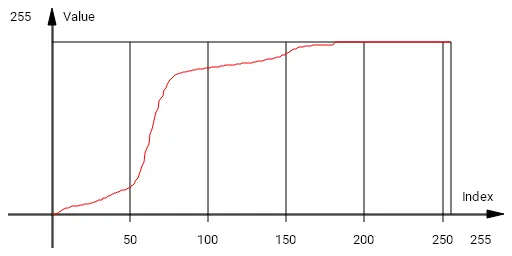
Equalization lookup table.
Image Focus
EasyImage::Focusing() .NET Python returns a measure of how well-focused an image is, by computing its total gradient energy. Calling it repeatedly on images captured at different focus positions gives you the basis of an auto-focus routine: the position that yields the highest value is the sharpest.
The measure relies on image gradients, which highlight the edges of structures in the image. A well-focused image has sharp edges and therefore strong gradient values; a poorly focused image has soft edges and weaker gradient values.
To compute the total gradient energy, eVision:
Computes the horizontal and vertical gradient images, and squares their pixel values.
Averages the squared pixel values, separately, over each gradient image.
Sums the two averages.
Takes the square root of the result.
Hint
The resulting value is highest when the image is well-focused, and decreases as focus quality drops.
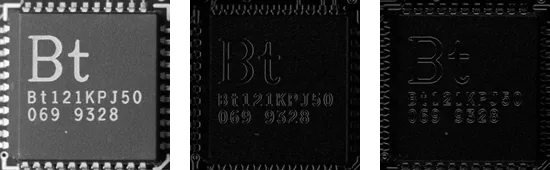
A well-focused image, with its (absolute-valued) horizontal and vertical gradients. The gradients show the edges of the structures with strong values. The total gradient energy for this image is 17.9.
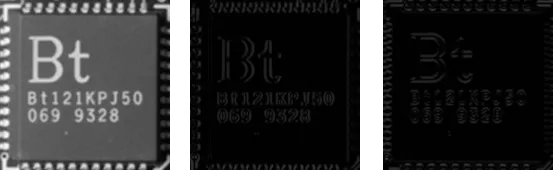
A badly focused image, with its (absolute-valued) horizontal and vertical gradients. The gradients show the edges of the structures with weak values. The total gradient energy for this image is 7.9.
EasyImage Statistics Functions
The class responsible for computing the statistics depends on the image type:
For
EImageBW8.NET Python images, useEImageStatisticsBW8.NET Python.For
EImageBW16.NET Python images, useEImageStatisticsBW16.NET Python.For
EImageC24.NET Python images, useEImageStatisticsC24.NET Python.
The next section explains the method using EImageStatisticsBW8 .NET Python to ease the reading. The target image and its optional region have to be set before calling the getters using EImageStatisticsBW8::SetImage() .NET Python.
Binary and Weighted Moments
EImageStatisticsBW8::GetBinaryMoments() .NET Python computes the binary moments of pixels above or equal to EImageStatisticsBW8::SetHighThreshold() .NET Python up to the requested order on the image.
Returns a vector containing the moments in the following order (up to the maxOrder given):
returnedArray[0]is the area (0th order moment).returnedArray[1]is the sum of abscissas (1st order, uncentered moment).returnedArray[2]is the sum of ordinates (1st order, uncentered moment).returnedArray[3]is the sum of squared abscissas (2nd order, uncentered moment).returnedArray[4]is the sum of product of abscissas and ordinates (2nd order, uncentered moment).returnedArray[5]is the sum of squared ordinates (2nd order, uncentered moment).
Gravity Center (Average Pixel Coordinates Above/On Threshold)
EImageStatisticsBW8::GetGravityCenterOfPixelsAboveHighThreshold .NET Python computes the coordinates of the gravity center of an image. The gravity center is computed on the pixels whose value are above the set high threshold (set using EImageStatisticsBW8::SetHighThreshold()).
Pixel Count (Between 2 Thresholds)
High and low threshold can be set using EImageStatisticsBW8::SetLowThreshold() .NET Python and EImageStatisticsBW8::SetHighThreshold() .NET Python
EImageStatisticsBW8::GetNumberOfPixelsBetweenThresholds.NET Python counts the pixels between low and high threshold.EImageStatisticsBW8::GetNumberOfPixelsBelowLowThreshold.NET Python counts the pixels below the low threshold.EImageStatisticsBW8::GetNumberOfPixelsAboveHighThreshold.NET Python counts the pixels above the high threshold.
Minimum, Maximum and Average Gray-Level Value
EImageStatisticsBW8::GetPixelMax.NET Python computes the maximum value in an image.EImageStatisticsBW8::GetPixelMin.NET Python computes the minimum value in an image.EImageStatisticsBW8::GetPixelAverage.NET Python computes the average pixel value. For a color image, it computes the means of the three pixel color components, the variances of the components and the covariances between pairs of components.
Variance and Standard Deviation
EImageStatisticsBW8::GetPixelVariance.NET Python computes average and variance of pixel values.EImageStatisticsBW8::GetPixelStdDev.NET Python computes average and standard deviation of pixel values. For a color image, it computes the standard deviations and correlation coefficients (covariance over the product of standard deviations) of the pairs of pixel component values.
Number of Different Pixels by Comparing 2 Images
EasyImage::PixelCompare.NET Python counts the number of different pixels between two images.
Supported Types
Method |
Supported Types |
|---|---|
Sliding Window ( |
BW8, BW16 |
Histogram ( |
BW8, BW16, BW32 |
Histogram Equalization ( |
BW8, BW16 |
Image Focus ( |
BW8, BW16, C24 |
Image Statistics (moments, pixel count, min/max/avg, variance/stddev) |
BW8, BW16, C24 (note: |
Pixel Compare ( |
BW8, BW16, C24 |
See Also
Easy to understand, ready to copy code snippets.
Use computed histograms to select and apply thresholds to an image.