EasyGauge - Measuring down to Sub-Pixel
Purpose
Note
This section is about the new EasyGauge API. The previous version of the API is described in the Legacy EasyGauge.
EasyGauge can measure and fit various geometrical shapes (rectangles, circles, polygons, wedges, lines and points) to edges in the images.
To find and measure a geometrical shape:
Create a gauge object that corresponds to the required geometrical shape.
Set the nominal shape on the object.
The nominal shape is an approximate definition of the shape to be measured.
Use
EBaseGauge::GetNominal.NET Python or the overloads in each gauge class (ERectangleGauge::SetRectangle.NET Python for example).
Set the tolerances of the shape.
The tolerances express how far away from the nominal shape to search for edge-crossing in the image.
Optionally change the various measurement and fitting parameters.
Call
EBaseGauge::Measure.NET Python to perform the measurement and get the measured shape.It throws an exception if the shape cannot be found.
The nominal shape, tolerance, various measurement parameters and the measured shape can be expressed with respect to a reference frame (EFrame .NET Python) given as a parameter to EBaseGauge::Measure .NET Python.
To perform calibrated or metric gauging, use a calibrated reference frame.
Note
The theoretical best-case accuracy is 1/64th pixel for all EasyGauge operators. In practice, you can assume an accuracy of 1/10th pixel.
See also
See Geometrical Shapes, Frame and Alignment, and Calibration.
Gauge Types
Point Gauge
Description: the point gauge finds points along a line probe segment that crosses the edges as specified by the measurement parameters.
Nominal shape: a line segment (
ELine.NET Python).Use
EPointGauge::GetNominalLine.NET Python to set the nominal line .
Measured shape: a point set (
EPointSet.NET Python).Use
EPointGauge::GetMeasuredPointSet.NET Python to get the measured set of points.Use
EPointSet::GetPoint.NET Python to get a measured point.Use
EPointSet::GetPoints.NET Python to get all the points.
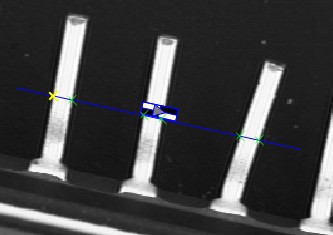
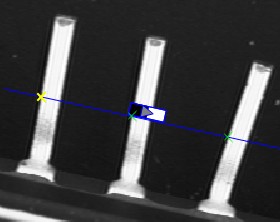
Example of point gauges. On the left, both black to white and white to black transitions are detected. On the right, only black to white transitions are detected.
Line Gauge
Description: the line gauge finds a line segment that follows an edge as specified by the measurement parameters.
Nominal shape: a line segment (
ELine.NET Python).Use
ELineGauge::GetNominal.NET Python to set the nominal line.
Measured shape: a line segment (
ELine.NET Python)Use
ELineGauge::GetMeasuredLine.NET Python to get the measured line.
Specific parameters:
Set
ELineGauge::GetKnownAngle.NET Python totrueto fix the slope of the line.
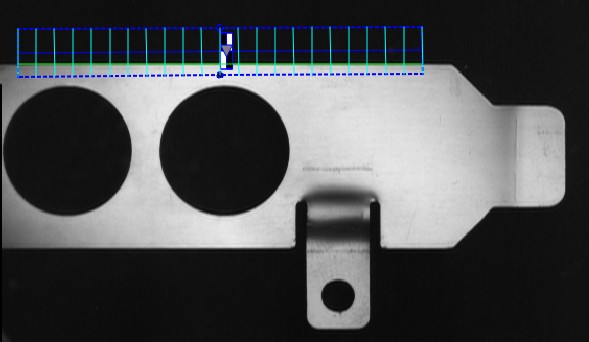
Example of a line gauge.
Rectangle Gauge
Description: the rectangle gauge finds a rectangle that fits edges of the image as specified by the measurement parameters.
Nominal shape: a rectangle (
ERectangle.NET Python).Use
ERectangleGauge::GetNominal.NET Python to set the nominal rectangle .
Measured shape: a rectangle (
ERectangle.NET Python).Use
ERectangleGauge::GetMeasuredRectangle.NET Python to get the measured rectangle.
Specific parameters:
Use
ERectangleGauge::GetActiveEdges.NET Python to set the edge to fit to the image.The active edges of the rectangles are a combination of the value of the enumerate
ERectangleGaugeEdge.NET Python (Left,Right,Bottom,Top).Set
ERectangleGauge::GetKnownAngle.NET Python totrueto fix the orientation of the rectangle.
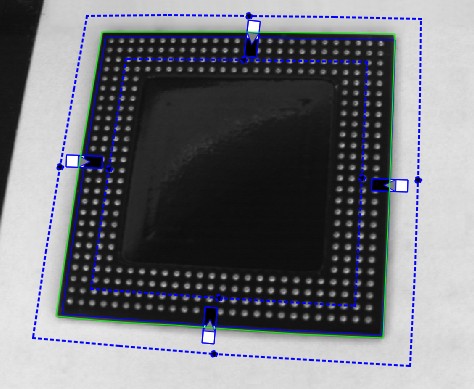
Example of a rectangle gauge.
Circle Gauge
Description: the circle gauge finds a circle that fits edges of the image as specified by the measurement parameters.
Nominal shape: a circle (
ECircle.NET Python)Use
ECircleGauge::GetNominal.NET Python to set the nominal line.
Measured shape: a circle (
ECircle.NET Python)Use
ECircleGauge::GetMeasuredCircle.NET Python to get the measured circle.
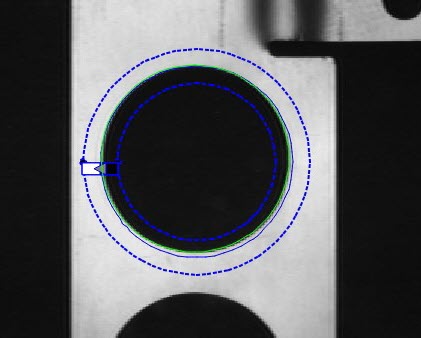
Example of a circle gauge.
Wedge Gauge
Description: the wedge gauge finds a wedge that fits edges of the image as specified by the measurement parameters.
Nominal shape: a wedge (
EWedge.NET Python)Use
EWedgeGauge::GetNominal.NET Python to set the nominal wedge.
Measured shape: a wedge (
EWedge.NET Python)Use
EWedgeGauge::GetMeasuredWedge.NET Python to get the measured wedge.
Specific parameters:
Use
EWedgeGauge::GetActiveEdges.NET Python to set the edge to fit to the image.The active edges of the wedge are a combination of the value of the enumerate
EWedgeGaugeEdge.NET Python:EWedgeGaugeEdge_Inner: inner circle edge.EWedgeGaugeEdge_Outer: outer circle edge.EWedgeGaugeEdge_Origin: segment linking the inner and outer edge at theEWedge::GetAngle.NET Python.EWedgeGaugeEdge_End: segment linking the inner and outer edge atEWedge::GetAngle.NET Python andEWedge::GetAmplitude.NET Python.
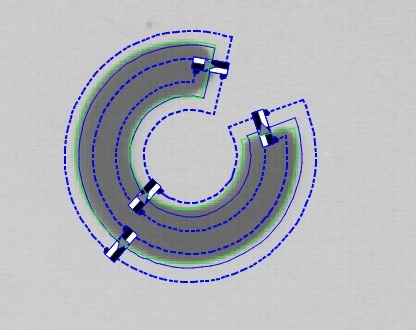
Example of a wedge gauge.
Polygon Gauge
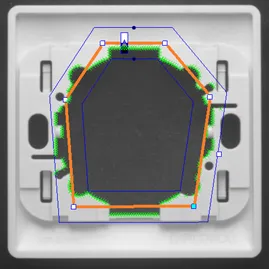
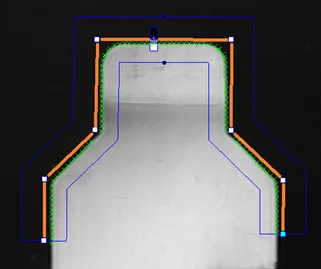
In orange, the closed or open polygon gauge and, in green, the measured transition points
Description: the polygon gauge finds a polygon that fits edges of the image as specified by the measurement parameters.
Nominal shape: a polygon (
EPolygon.NET Python)Use
EPolygonGauge::GetNominal.NET Python to set the nominal polygon.
Measured shape: a polygon (
EPolygon.NET Python)Use
EPolygonGauge::GetMeasuredPolygon.NET Python to get the measured polygon.When using the global measurement mode, the nominal polygon is transformed using an isotropic affine transform:
Use
EPolygonGauge::GetMeasuredPolygonTransformation.NET Python to get theEFrame.NET Python object corresponding to this transformation.Scaling is only considered if
EPolygonGauge.EnableScalingis true.Use
EPolygonGauge::GetMeasuredOffset.NET Python,EPolygonGauge::GetMeasuredScale.NET Python andEPolygonGauge::GetMeasuredAngle.NET Python to directly get the offset, scale and angle of the transformation.
Specific parameters:
The measurement mode:
EPolygonGauge::GetMeasurementMode.NET PythonIn the mode
EPolygonMeasurementMode_Global.NET Python, the polygon is rigid and the measured polygon is an isotropic affine transformation of the nominal polygon.The position, orientation and optionally the scale of the polygon are adjusted to fit the measured points.
By default, the measurement mode is
EPolygonMeasurementMode_Global.NET Python.If a scaling is required, you must enable it with
EPolygonGauge::GetEnableScaling.NET Python.
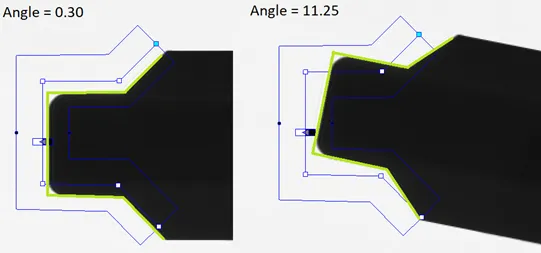
The
Globalmeasurement mode: the measured polygon is a translation and a rotation of the input polygon¶In the mode
EPolygonMeasurementMode_Edge.NET Python, the edges of the polygon are measured independently.The result is a new polygon composed of each of the nominal edge fitted to the image.
The number of edges of the measured polygon is the same as the nominal polygon.
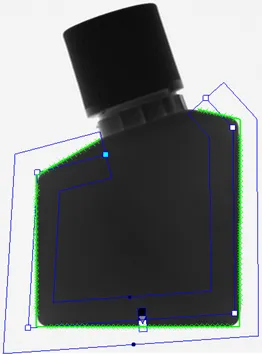
The input polygon (blue) and the fitted polygon (green)
In the mode
EPolygonMeasurementMode_Point.NET Python, the measured polygon edges are sampled to fit closely to all the measured points.The measured polygon is simplified using a filtering threshold (
EBaseGauge::GetFilteringThreshold.NET Python) to reduce the number of edges while keeping the shape of the object.The measured number of edges depends on the geometry of the contour of the object and on the filtering threshold.
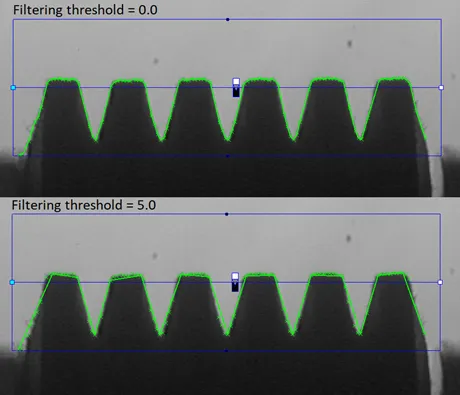
A polygon gauge with a single edge produces a measured polygon that follows the contour of the object
Depending on the filtering threshold, the number of vertices is reduced.
Principles of EasyGauge
Finding Transition Points
All gauges are based on finding the position of all the transition points, called sample points, along a line segment probe, called the sample path, that cross one or several object edges and selecting the most relevant ones.
To do that, EasyGauge extracts the pixel values along the sample path (the red curve) then uses the peak analysis to determine the transition location. All the pixel values in the peak area are used to compute the transition location.
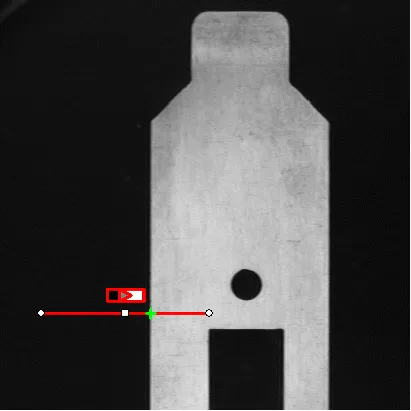
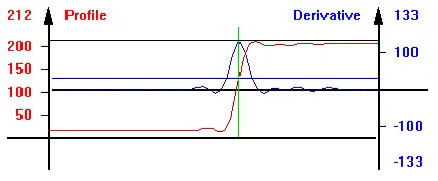
On the left, a measured point on a sample path. On the right, the pixel value profile and its derivate along the sample path.
On a sample path extracted from an image:
An edge appears as a transition from dark to light (or vice versa).
When plotting the pixel values along the sample path, this transition appears as an S-shaped curve.
The first derivative of this curve exhibits a peak around the transition point.
Hint
The better the contrast, the sharper the transition and the higher the peak.
Sub-pixel accuracy is only possible if the transition is surrounded by almost uniform regions of at least 2 pixels wide.
Measuring Complex Shapes
Except for the point gauge, all gauges try to find and measure complex shapes with the following algorithm:
Place sample paths along the nominal shape at regular interval
Measure each sample path to find sample points on this path.
Select one sample point for each sample path.
Fit the shape to the selected sample points.
Fitting the shape means adjusting its parameters to minimize the error residue (average distance of the sample points to the measured shape).
The fitting algorithm can include an iterative outlier rejection process, that will reject sample points that may harm the location accuracy:
Apply the model fitting to the valid sample points.
The sample points that are too far away from the fitted model and may harm the location accuracy are made invalid.
Repeat the proccess.
Measurement and Fitting Parameters
Finding Sample Points
All the gauges and ESamplePath .NET Python contain all the point measurement parameters, with default values that detect reasonably contrasted edges:
Transition strength:
SetThreshold.NET Python,SetMinAmplitude.NET Python andSetMinArea.NET Python.Transition type:
SetTransitionType.NET PythonTransition choice:
SetTransitionChoice.NET Python andSetTransitionIndex.NET Python.Local filtering for noise immunity:
SetThickness.NET Python andGetSmoothing.NET Python.Sampling area (rectangular by default) for transverse filtering
SetRectangularSamplingArea.NET Python.
Transition Strength
The threshold .NET Python level is very important:
Too high and significant transitions can be missed and insufficient pixel values can achieve good precision.
Too low and noise can cause false transitions.
To resolve this dilemma, the EasyGauge transition selection mechanism can reject low contrast or false edges:
The transition strength is measured by the peak amplitude and the area.
Every edge measurement determine the peak amplitude and the area.
The peak amplitude is the difference between the peak value and the threshold.
The peak area is the area under the peak curve and the horizontal line at the threshold value.
If either value falls below the
minimum amplitude.NET Python or theminimum area.NET Python, the peak is disregarded and no point is assumed at that location.
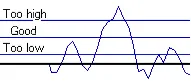
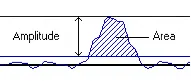
Transition Type
Select the type of transition to find with SetTransitionType .NET Python:
Simple edges:
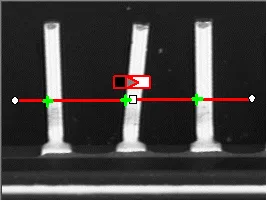
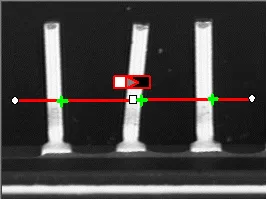
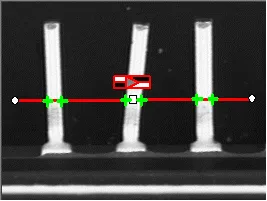
Black to white, white to black and indifferent polarities
Complex edges:
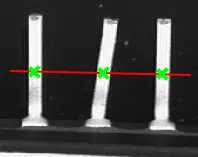
Complex “Black to white to black” transition type.
Hint
You cannot normally detect transitions using the default threshold value (20) as BWB or WBW transitions base the peak analysis on the gray level profile along the sample path and not its first derivative.
Selecting the Most Relevant Transition
There can be multiple transitions that match the transition detection parameters. The parameter SetTransitionChoice .NET Python can be used to select the single most relevant transition. With point gauges, this parameter can have the value ETransitionChoice_All .NET Python, which will return all the transitions matching the other parameter of the detection.
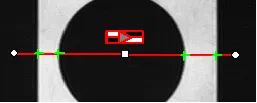
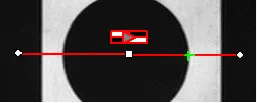
Multiple transitions measured (left) and single transition measured (right).
You can select the single most relevant transition based on 4 criteria:
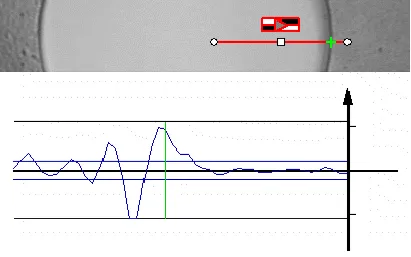
The highest peak |
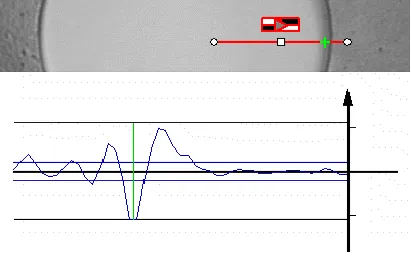
The peak with the largest area |
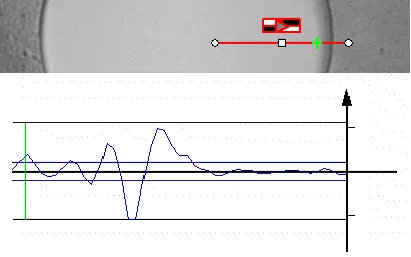
The peak closest to the gauge center |
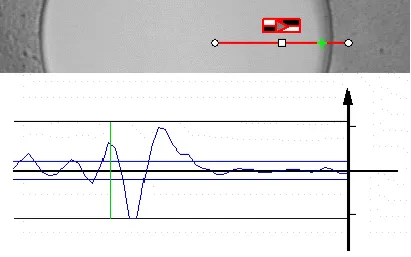
The nth peak encountered |
Note
When several peaks have the same value (same area, same amplitude…), the last peak is selected.
Filtering noise
Filtering the image locally can reduce the noise effects.
There are 2 types of filtering:
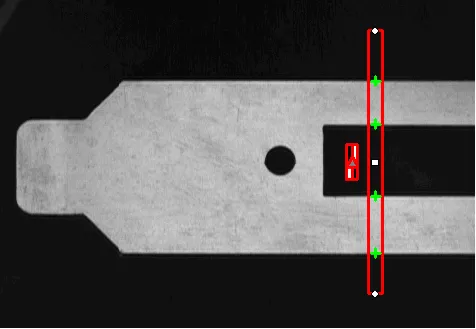
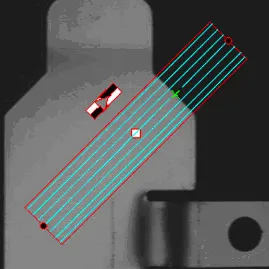
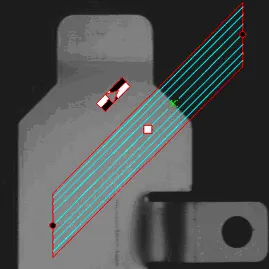
The transverse (lengthwise) filtering averages several parallel lines when sampling the image.
The longitudinal (crosswise) uniform filtering can also be applied to the resulting profile curve (
SetSmoothing.NET Python)
Configuring Sample Paths
Use
SetSamplingStep.NET Python to set the spacing between the paths.Use
GetNumSamples.NET Python to get the number of paths that are sampled.
Use
SetTolerance.NET Python to set the length of these paths that is the half-length of the line segment. The tolerance is how far to look for edge crossings around the nominal shape.Note
Note that the
EPointGauge.NET Python has no tolerance because it consists in the measurement of edge-crossing on its nominal line.
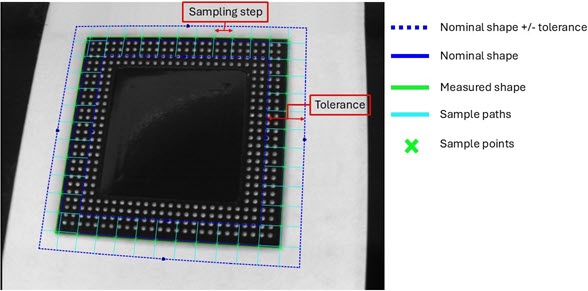
EasyGauge measurement concepts
Fitting Parameters
Outlier rejection parameters:
Skip ranges:
The skip ranges define the exclusion ranges for the paths. The sample point indexes in the skip ranges are not taken into account to fit the model.
Note
The skip ranges apply to all gauge models but the polygon gauge.
Use
AddSkipRange.NET Python to define several skip ranges.Use
RemoveSkipRange.NET Python,RemoveAllSkipRanges.NET Python andGetSkipRange.NET Python to manage the skip ranges.Use the attribute
EDrawingMode_PointsInSkipRange.NET Python with the methodDraw.NET Python to display the skipped points.
Advanced Usage
Analyzing the Results
Use
MeasureSamplePath(n).NET Python to perform the measurement of the n-th sample path.This measurement can be useful to tune the transition measurements parameters. See the section below.
This method returns an
ESamplePath.NET Python object:Use
GetSamplePath.NET Python to get the line segment of the path.Use
GetMeasuredPoint.NET Python to get the selected measured point or useGetMeasuredPoints.NET Python to get all the measured points.Use
Plot.NET Python to plot the profile and/or the derivative of the path.
After having measured the gauge with
EBaseGauge::Measure.NET PythonUse
GetSample(n).NET Python to get the measuredsample point.NET Python of the n-th sample path. The sample point contains:Use
GetNumValidSamples.NET Python to get the number of valid sample points remaining after the model fitting operation.Use
GetAverageDistance.NET Python to get the average distance of these points to the fitted model.
Tuning the Transition Measurement Parameters for Unclear Transitions
The EasyGauge default parameters and working modes are good for clear transitions.
More complex situations may need the tuning of additional parameters. Here, we show how to tune a point gauge. However, you can apply the same method to the other gauges by analyzing their sample paths.
Set the gauge point location and tolerance.
Sets the nominal line of the point gauge. Its
center position.NET Python andorientation.NET Python are easy to decide based on a sample image or on the coordinate considerations.The
tolerance.NET Python depends on the edge position variations. A larger tolerance increases the likelihood of hitting an edge, but it may be a false edge or an extraneous feature.
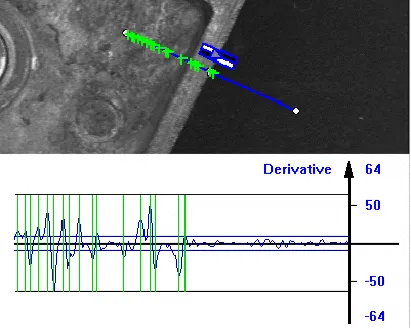
Placing the gauge.
Decide whether a noise reduction is required.
Lay the gauge over the desired location and observe the profile curve and its derivative (play with the filtering parameters while looking at the plotted curve).
The curve regularity gives an indication of the spread of the gray-level values.
When these coefficients are set, the gray-level profile will not change anymore.
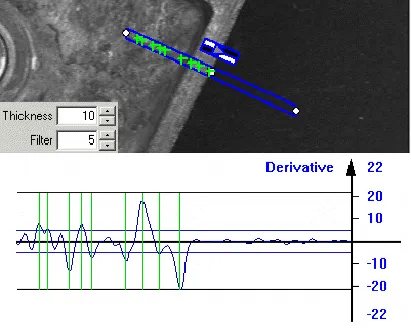
Filtering noise.
Set the threshold value.
Set a value low enough for useful parts of the peaks to cover enough pixels (to achieve better sub-pixel accuracy), but not lower than the ambient image noise.
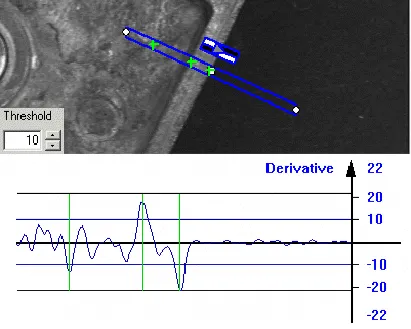
Thresholding.
Remove weak or false transitions.
Use the list of peak amplitudes and areas.
Plotting these values along with good and extraneous peaks can help find appropriate peak rejection limits.
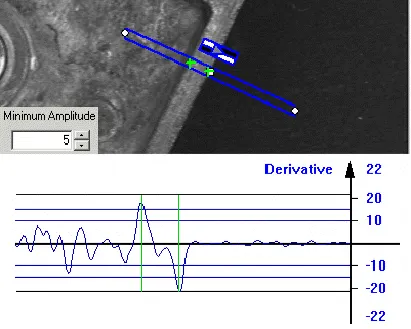
Using the amplitude and area to filter out weak or false transitions.
Choose whether all transition points are needed or just the most relevant.
If all the transition points are required, you can query them one after the other.
Otherwise, choose a point selection strategy based on the strength, the order or the transition polarity (black to white and/or conversely).
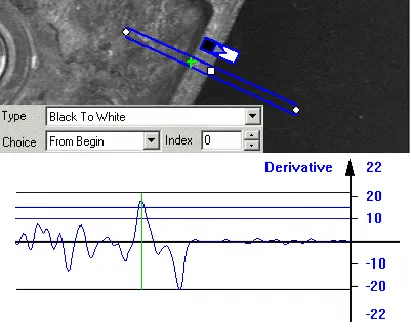
Select the relevant transition point.
Display and Graphical Manipulation
Drawing
EBaseGauge::Draw .NET Python gives a graphical representation of the gauge.
Use the enumerate EDrawingMode .NET Python to specify the parts of the gauge that you want to draw:
EDrawingMode_Nominalto draw the nominal shape, the gauge tolerances and the handles.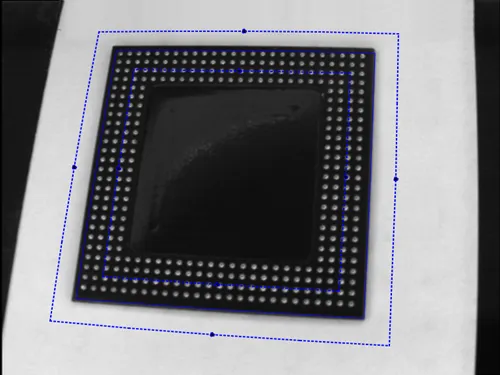
EDrawingMode_Actualto draw the measured shape.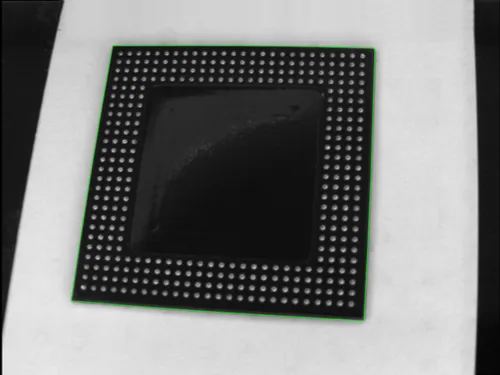
EDrawingMode_Tolerancesto draw the tolerances around the nominal shape and its handles.EDrawingMode_TransitionTypeto draw the transition type of each edge of the shape.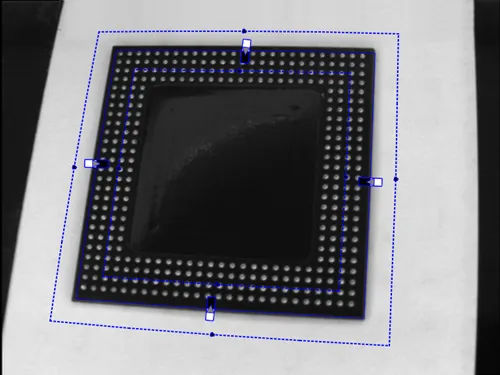
EDrawingMode_SampledPathsto draw the paths sampled along the nominal shape.EDrawingMode_SampledPointsto draw the points measured along each path sampled along the nominal shape that were used to fit the shape.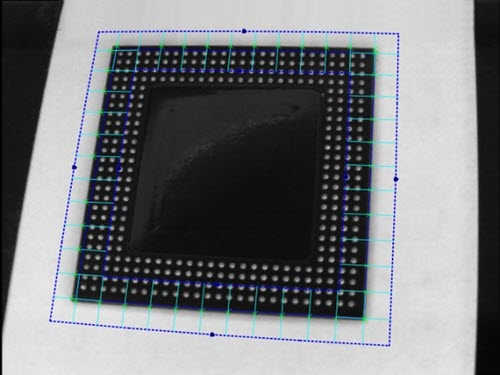
Sampled paths and sampled points
EDrawingMode_InvalidSampledPointsto draw the points measured along each path sampled along the nominal shape that were excluded from the shape fitting operation (outliers).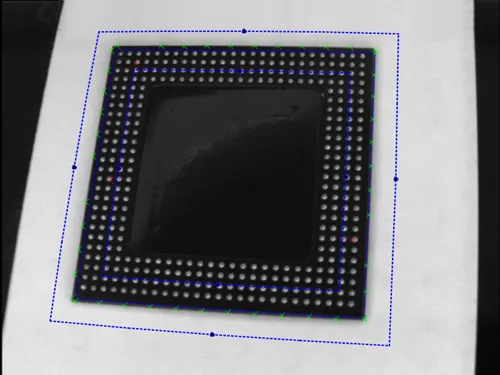
Sampled points (green) and invalid sampled points (red)
EDrawingMode_PointsInSkipRangeto draw the points in the skip ranges for the gauges that support skip ranges.
Graphical Manipulations
Use
EBaseGauge::GetAvailableEditionModes.NET Python to get the available graphical edition mode.It returns the edition modes of the underlying nominal shape and
EEditionMode_Tolerances.NET Python if the gauge has tolerances.
Use
EBaseGauge::SetEditionMode.NET Python to set the edition modes that you want to activate.Use
EBaseGauge::HitTest.NET Python to determine when the mouse cursor is over a handle and get the corresponding edition mode that you can use to change the shape of the mouse.Use
EBaseGauge::Drag.NET Python to move the handle and the corresponding gauge accordingly.
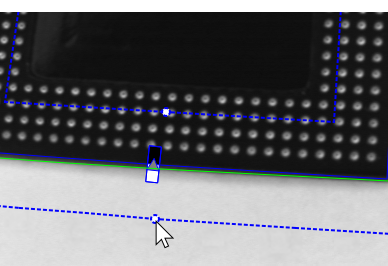
Handles for the graphical manipulation of the tolerances of the gauge.
Note
With the API, you can perform graphical manipulation on the nominal shape and on the tolerances of the gauge. However, in eVision Studio, only the tolerances can be manipulated in the gauge tools.
Plot
EasyGauge can plot gray-level values along the sample paths and/or its derivative. This is useful to tune the parameters.
Use
EBaseGauge::MeasureSamplePath.NET Python to get the measured sample path for one of the sample paths of the gauge.Use
ESamplePath::Plot.NET Python to plot the profile and/or the derivative.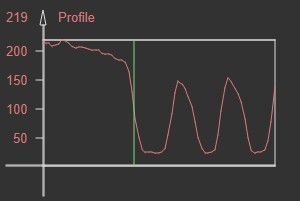
Profile of a measured sample
Use
ESamplePath::DrawPath.NET Python to draw the sample path that was measured.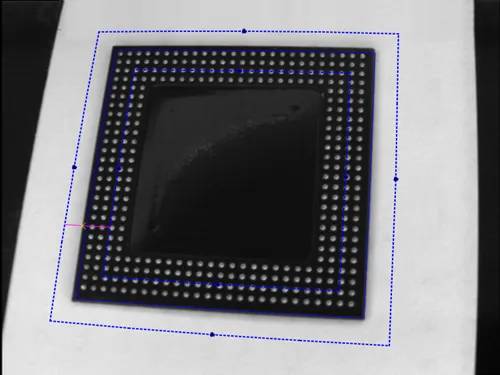
Sampled path (purple) and sampled points (yellow)
Frame
When calling the drawing and graphical manipulations methods, pass the frame in which the shape is defined.
Also pass the same frame to
EBaseGauge::Measure.NET Python.
See also
Have a look at the differences with the old legacy API of EasyGauge and how to port your application to the new API.