Running Tools on Images
Creating a Graph
When creating a project, the first step is to:
Add your tools.
Add links to connect your tools.
If necessary, select the link type.
Add an Image Tool
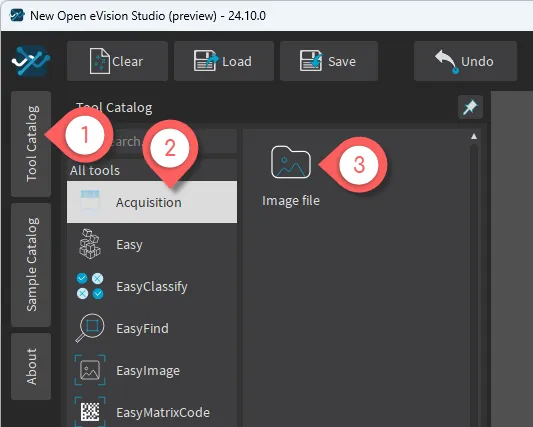
Tool CatalogAcquisition collectionImage file tool:The
Image filetool is added to the graph.Double-click again if you need several
Image filetools.
Add an ROI Tool
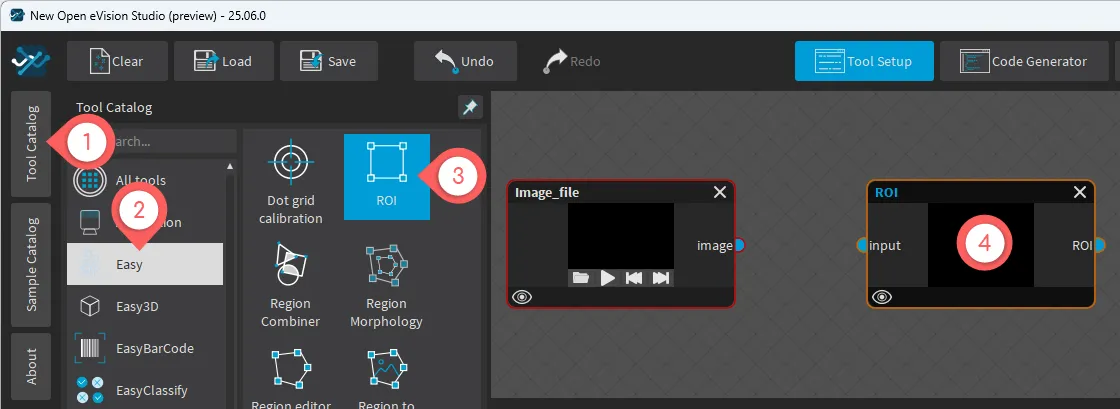
Tool CatalogEasy collectionROI tool:The
ROItool is added to the graph.
Add a Processing Tool
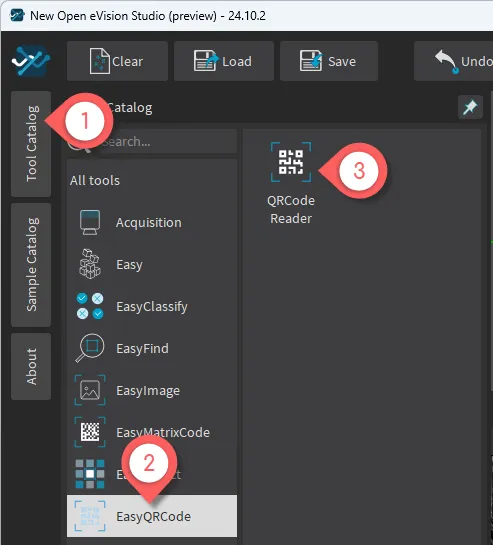
Tool CatalogEasyQRCode collectionQRCode Reader tool:The
QRCode Readertool is added to the graph.
Connect Image file to ROI
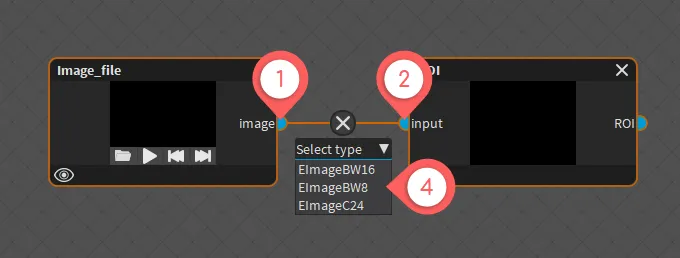
Image_file output image portROI input inputLink type for this connection:It is the format of the image that is transferred between both tools.
Note
In most cases, you do not need to select a
Link typeas theLink typewill be automatically set when you complete your graph.The tools are automatically and dynamically positioned on the graph.
As you start to create a graph by connecting tools, this graph is displayed on the first line while the other non-connected tools are left on the bottom line until you connect them.
Connect ROI to QRCode Reader
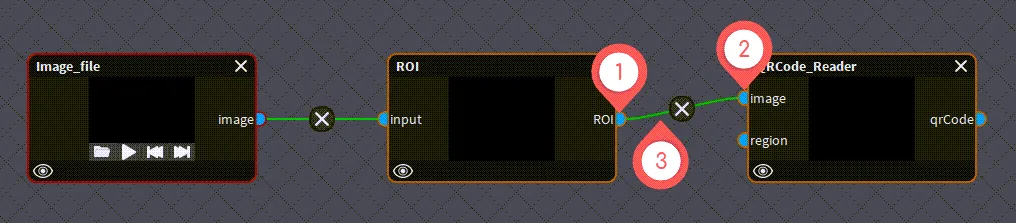
ROI output ROIQRCode Reader input image portConfigure the Tool
You can now configure your tools according to your application and setup.
Opening Images
In eVision Studio, you can open and process a single image or select multiple images and process them one at a time manually or through on automatic loop at a configurable speed.
Add and Remove Images
In the Setup View of the Image_file tool:
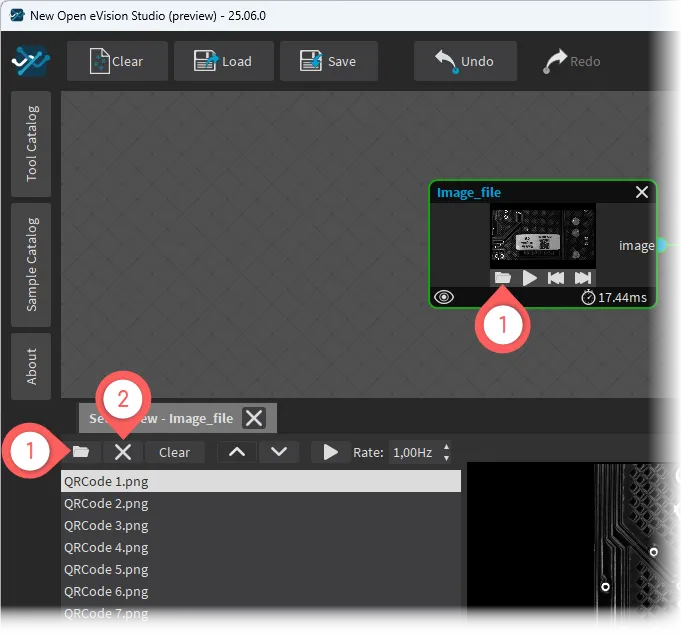
Click on the folder button:
Select your image(s) in the
Opendialog box.Use the CTRL and SHIFT keys to select several images.
You can also click on the same button directly in the
Image_filetool.
Click on the image in the list and press the X button or the DEL key.
Select and Process an Image
In the Setup View of the Image_file tool:
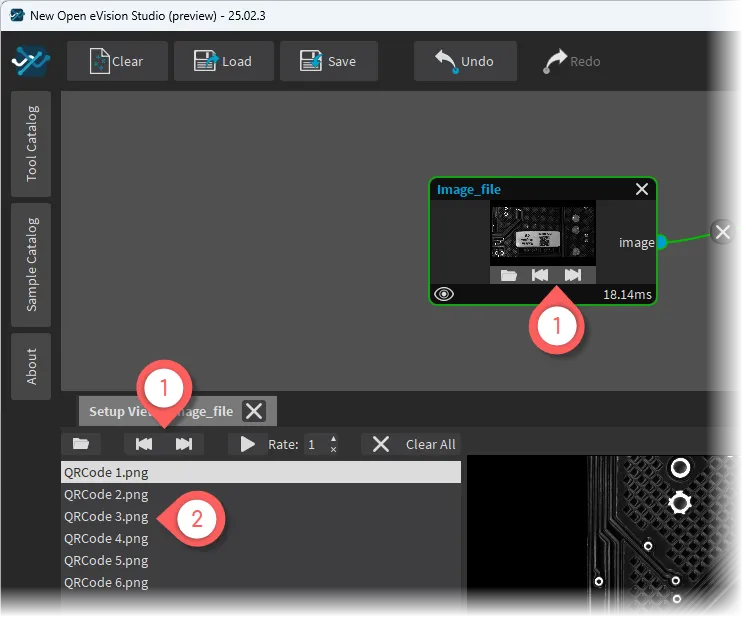
You can also click on the same buttons directly in the
Image_filetool.
The selected image is automatically processed if the graph is operational.
Automatically Loop Images
In the Setup View of the Image_file tool:
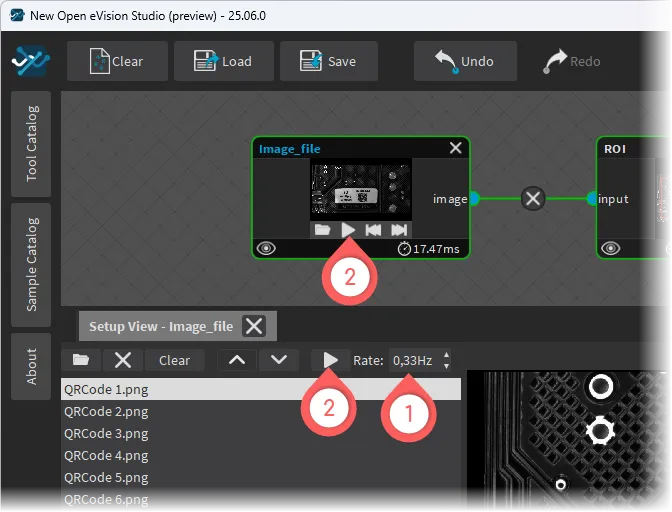
It is the number of images displayed per second in the field
Rate(in Hz).
It will start or stop the automatic looping of the images and their processing.
Managing an ROI
In some cases, most often to decrease the processing time or to single-out the object you want to analyze, you do not want to process the whole image but only a part of it.
You can define and use regions of interest (ROI) to restrict the area processed with your vision tool.
In eVision:
See also
This topic explains how to use an ROI, that is a rectangular shape attached to an image. If you want to use another form, consider Working with a Region.
Using the ROI Tool
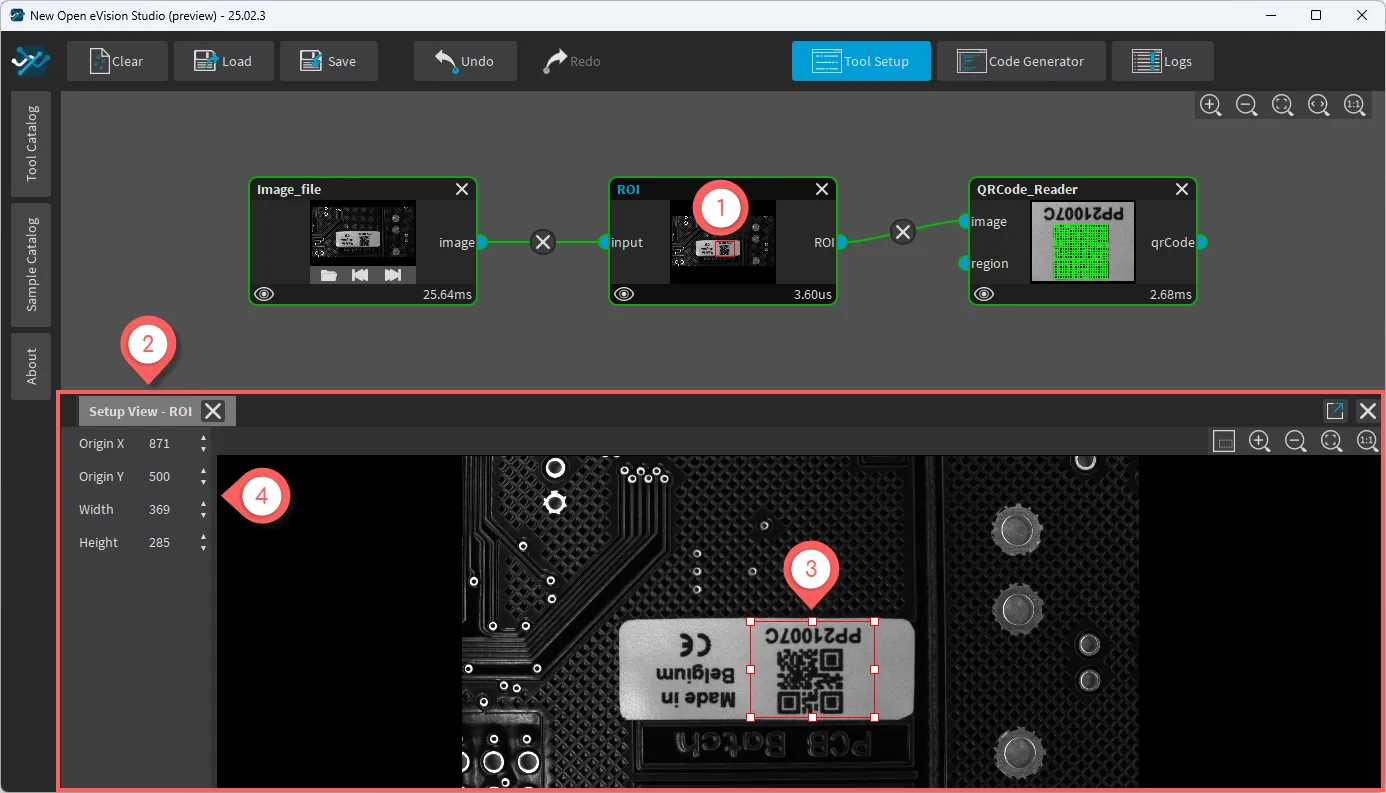
ROI toolSetup View opensClick in it and drag it to positions it.
Click and drag the handles to adjust its size.
Tool Configuration and Results
Once your image(s), including the ROI if you created one, are ready, you need to configure your tool(s).
Note
When you add a new tool on your graph, all parameters are set to their default value.
Open the Setup View
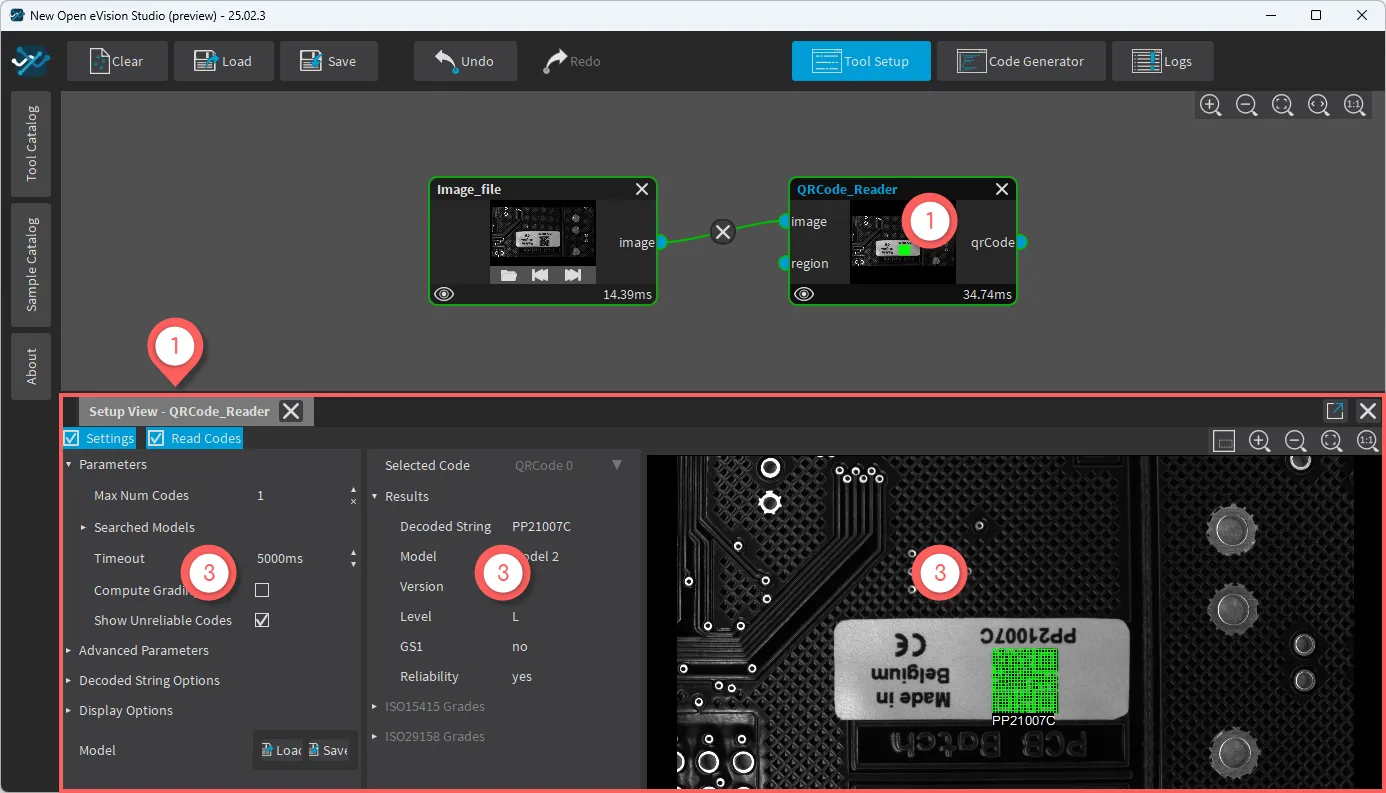
Image_file toolSetup View opensSetup View includes one or several panes next to the resulting imageAdjust Parameters
In the Setup View of the tool:
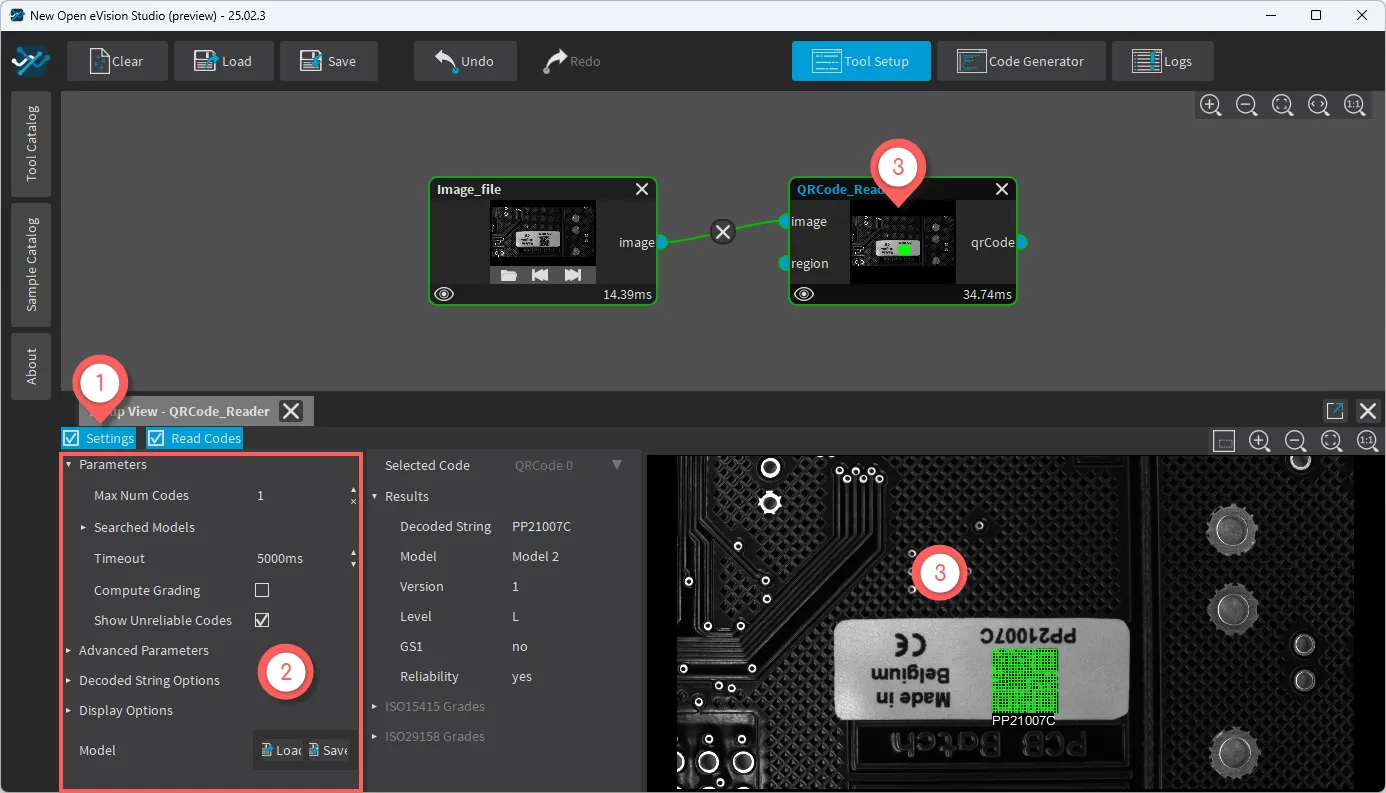
Settings pan:It display the parameter pan.
It may already be checked.
Both the graph and the views are updated accordingly.
Display Results
In the Setup View of the tool:
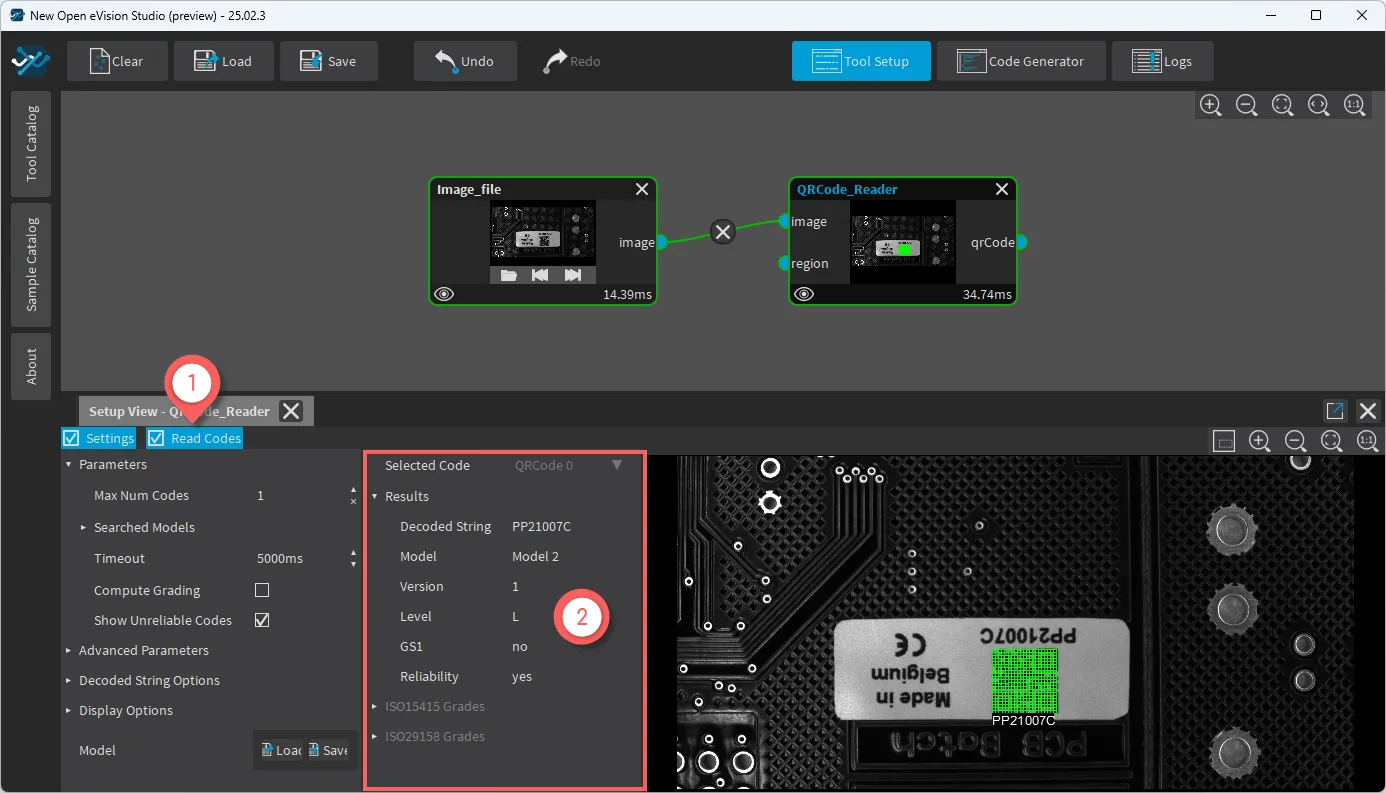
Result pan:Click on a pane name to display only this pane content.
It may already be checked.
Check the box next to a name to add a pane to the displayed panes.
Using the Generated Code
The eVision Studio can translate your graph into code that you can use in your application.
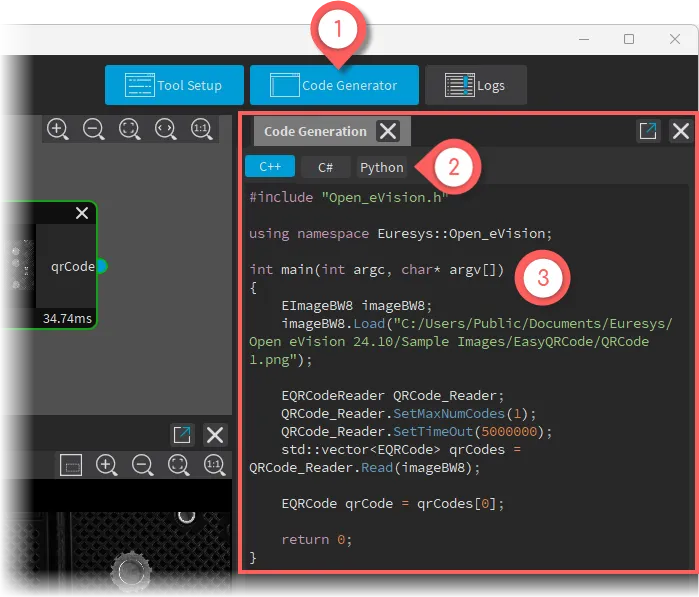
Code Generator button:It opens the
Code Generationpane.
It is ready to be used in your application
You can keep on changing the graph according to your needs.