Benchmarking a Deep Learning Tool
Adding and Configuring benchmarks
In Deep Learning Studio, if you have a Deep Learning license, you can benchmark your trained tools to measure their speed according to various execution parameters.
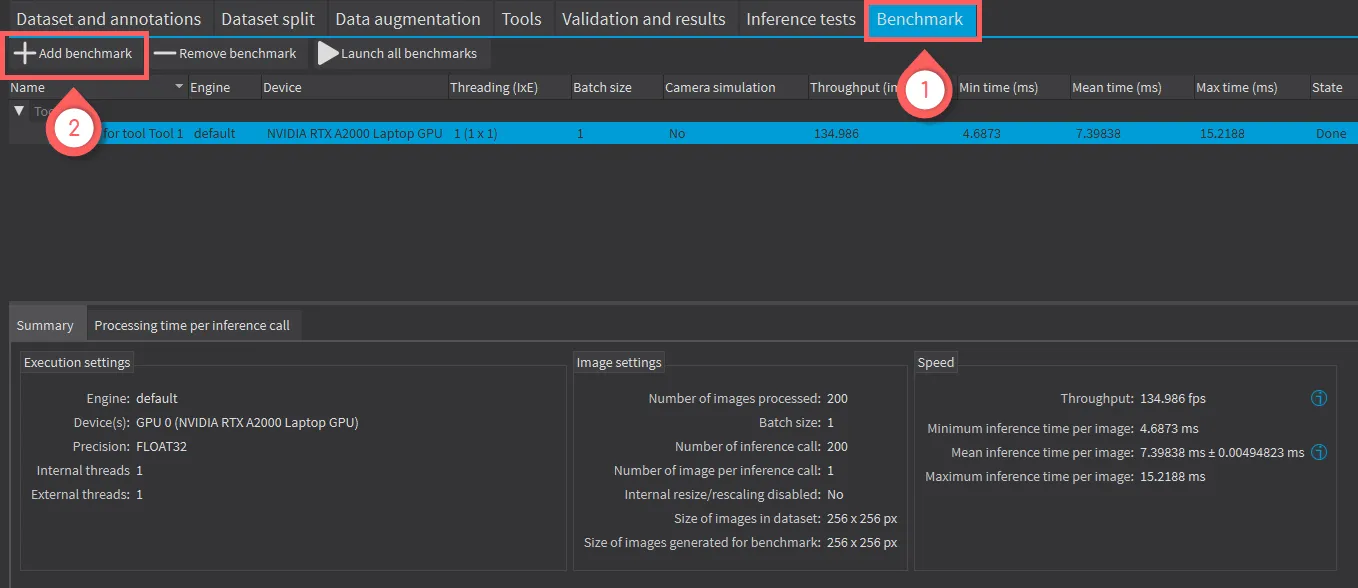
Open the
Benchmarktab.To add a benchmark, click on the
Add benchmarkbutton.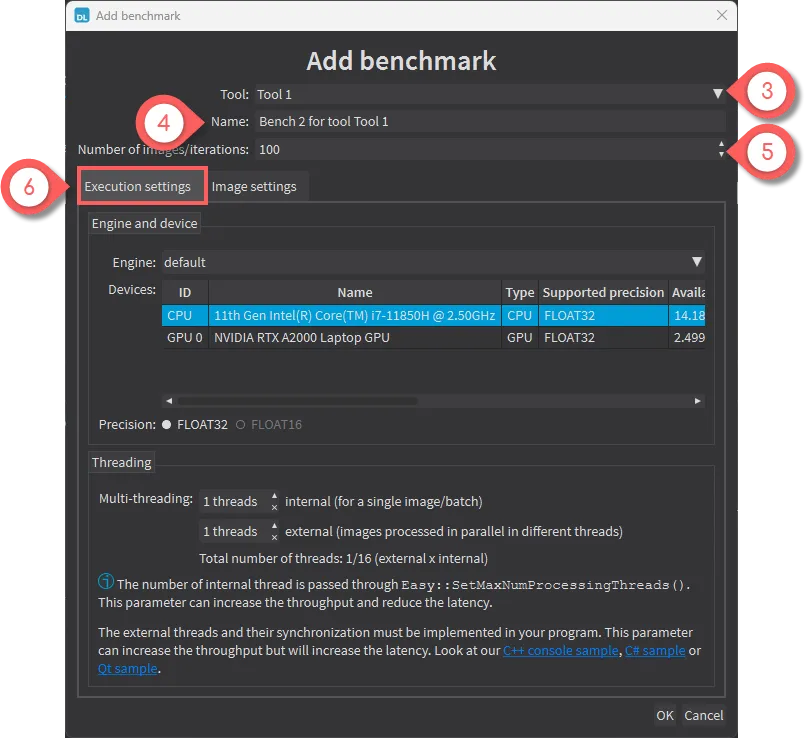
Adding a new benchmark. In the
Add benchmarkwindow, select theToolthat you want to benchmark. Only trained tool appear in the list.Nameyour benchmark.Set the
Number of images/iterationsto perform in the benchmark. The more images, the better the precision.In the
Execution settingstab, set the parameters that control how the neural network runs:The engine, device and inference precision.
The threading parameters.
Hint
Use the threading parameters when running the neural network on the CPU:
The internal threading can improve the processing speed for a single image. It also improves both the throughput (number of images processed by seconds) and the latency (time taken to process one image).
The external threading involves using the same tools in different threads on different images. This can greatly improve the throughput but it decreases the latency (it means that the number of images processed each seconds increases but the time to process a single image is longer on average).
Check the code samples referenced in the dialog for how to implement internal and external multithreading.
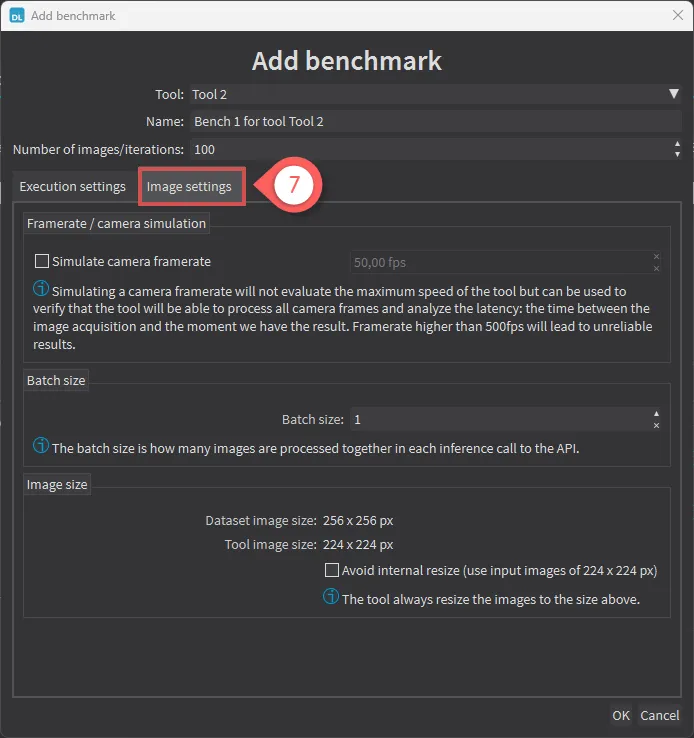
Image settings. In the
Image settingstab, set the the parameters that control how the images are preprocessed and given to the neural network:Simulate camera framerate: When checked, the benchmark does not try to perform inference at the maximum speed. Instead, images are produced at the specified frame rate.Use this setting to check if your execution settings can match the speed of your camera. Simulating a camera frame rate also gives you an estimation of the time spent between the acquisition of an image and the moment the result is available.
Batch size: Increasing the batch size can greatly improve the throughput, especially for GPU processing. However, it also increases the latency.Image size: By default, when applying a tool on an image that has a size different from the input size of the tool, the image is automatically resized by the tool. The time spent performing this resizing is part of the inference time.Check
Avoid internal resizeto avoid the resizing performed during inference and slightly accelerate the tool.In a real application, you can configure your camera to capture images directly of the input size of the tool to avoid this automatic resizing step.
Benchmark Results
The following benchmark results are available:
In the
Summarytab:The settings of the benchmark.
The troughput (number of images processed by seconds).
The minimum/ mean / maximum inference time per image.
In the
Processing time per inference call:A table and a graph with the processing times.
Note
An inference call means calling the inference API with a batch of images (see batch size setting).
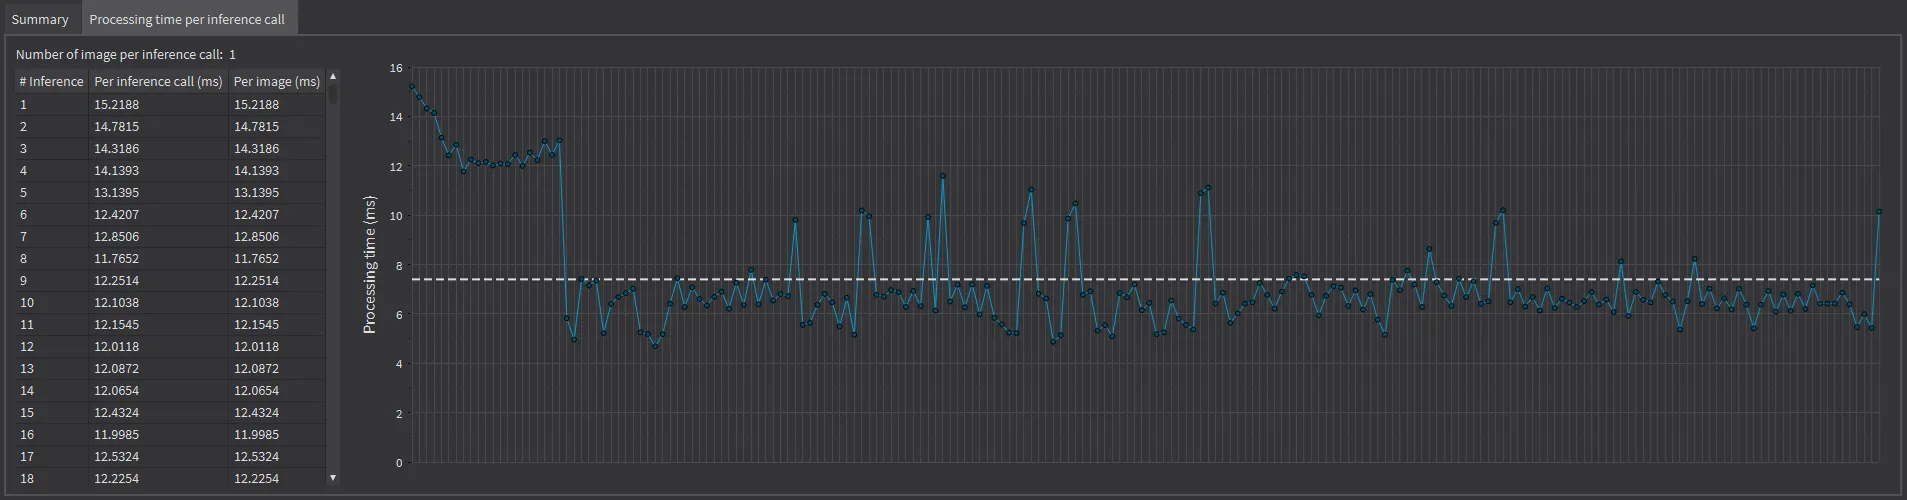
Graph of processing times. In addition in the
Summarytab, if you are simulating a camera frame rate: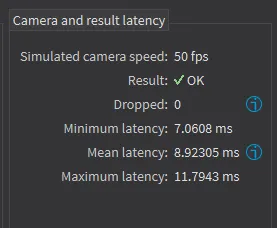
Simulated camera results
Whether all images could be processed in time.
The number of images that were dropped because the frame rate was too fast compared to the inference speed.
The minimum/ mean / maximum latency (the time between the acquisition of the image and the moment the result for this image is available).
The camera simulation details tab that contains a table showing the various timings for each image (acquisition time, inference start time, inference end / latency, inference time).
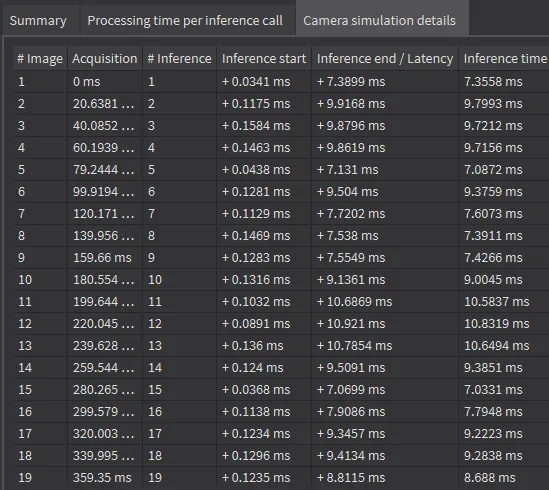
Camera similation details.