Retraining a Model
Flowchart
EasyDeepOCR uses several neural networks to locate, orient and recognize the texts.
In Deep Learning Studio, you can:
Retrain some neural networks on a few images.
Export these retrained models.
Use them in an
ETextReader.NET Python.

Trainable Models
There are 3 neural network models that you can retrain:
Location Model
Properties:
Scale (value between 0 and 1): the downscaling is applied to the image before the inference.
By default, in Deep Learning Studio, the scale is set so that the minimum height of any ground truth text is 64 pixels.Threshold (value between 0 and 1): the score under which the located texts are rejected.
By default, in Deep Learning Studio, the threshold is set after the training to maximize the recall (true positive rate).
When to retrain:
When no text is located at all.
When the text is badly detected.
When the text of interest is printed on top of an unimportant text.
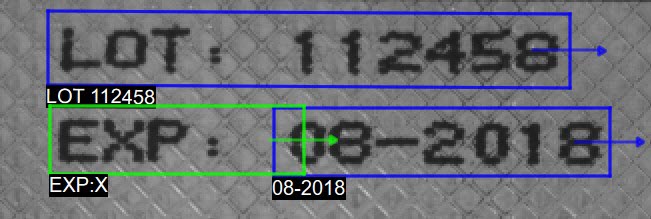
The green box does not fit correctly to a character group, as it included half of the `0` character. 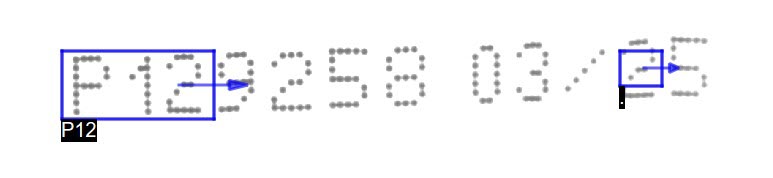
Many characters are undetected. 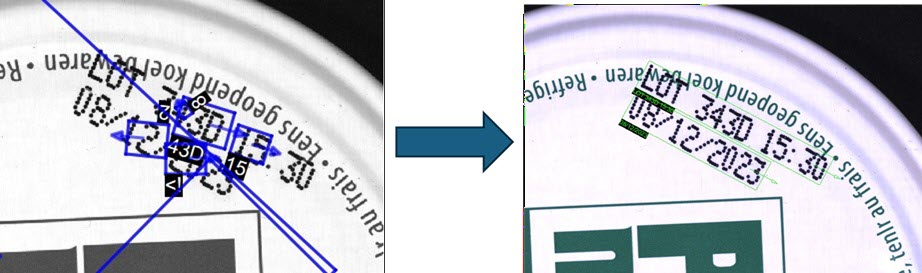
Training the locator on the important text only makes it more robust.
Orientation Model
Properties:
None.
When to retrain:
When the direction of the text is wrong.
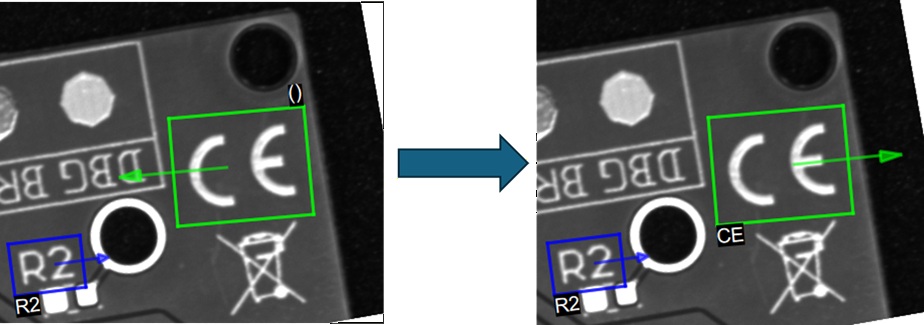
Recognition Model
Properties:
None.
When to retrain:
When the predicted text has mistakes in it (missing character, character mistaken for another one…).
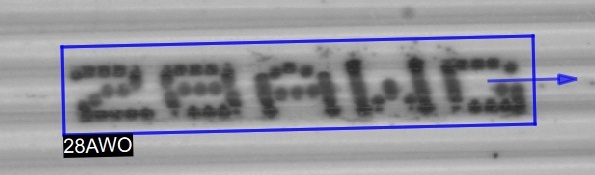
To identify new characters: annotate the new character using one of the characters in the supported dictionary.
Note
In simple cases, retraining these models can work with as few as 3 or 4 images containing a single text. However, the actual requirements depend on various factors and may be much greater than this.
Training a Custom Model
In Deep Learning Studio
No license is needed to train a custom model with Deep Learning Studio.
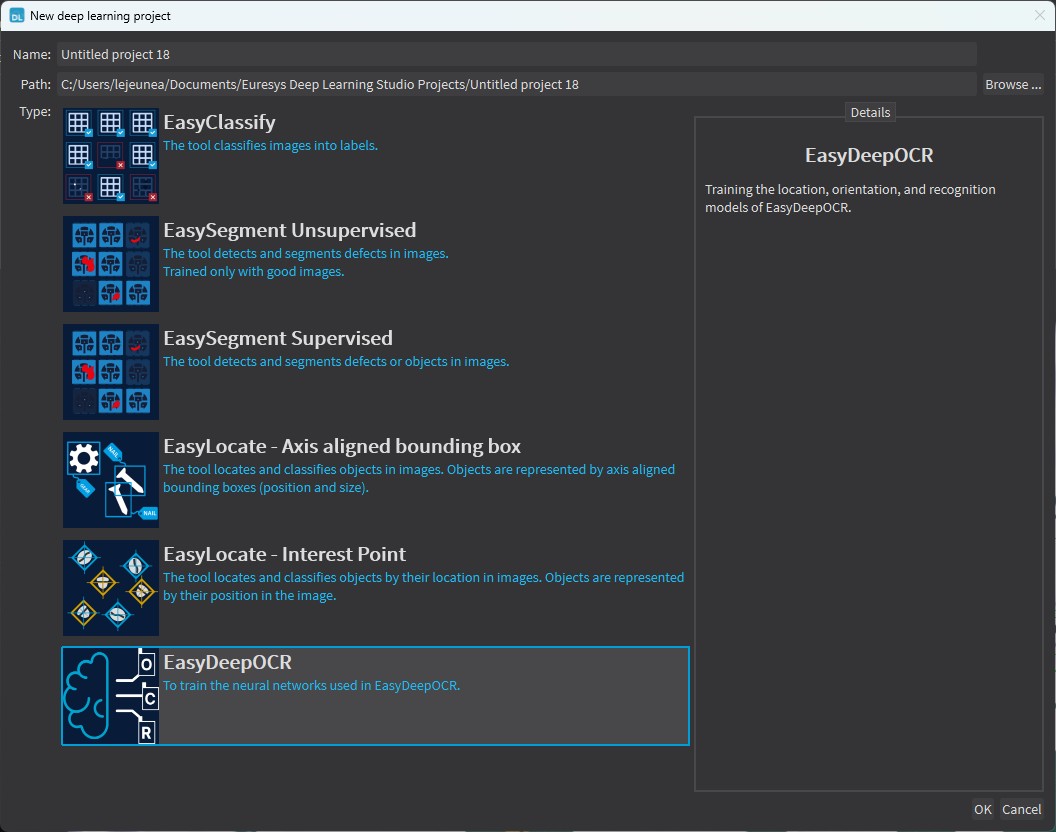
Create a new project EasyDeepOCR in Deep Learning Studio
Add your images and annotate them
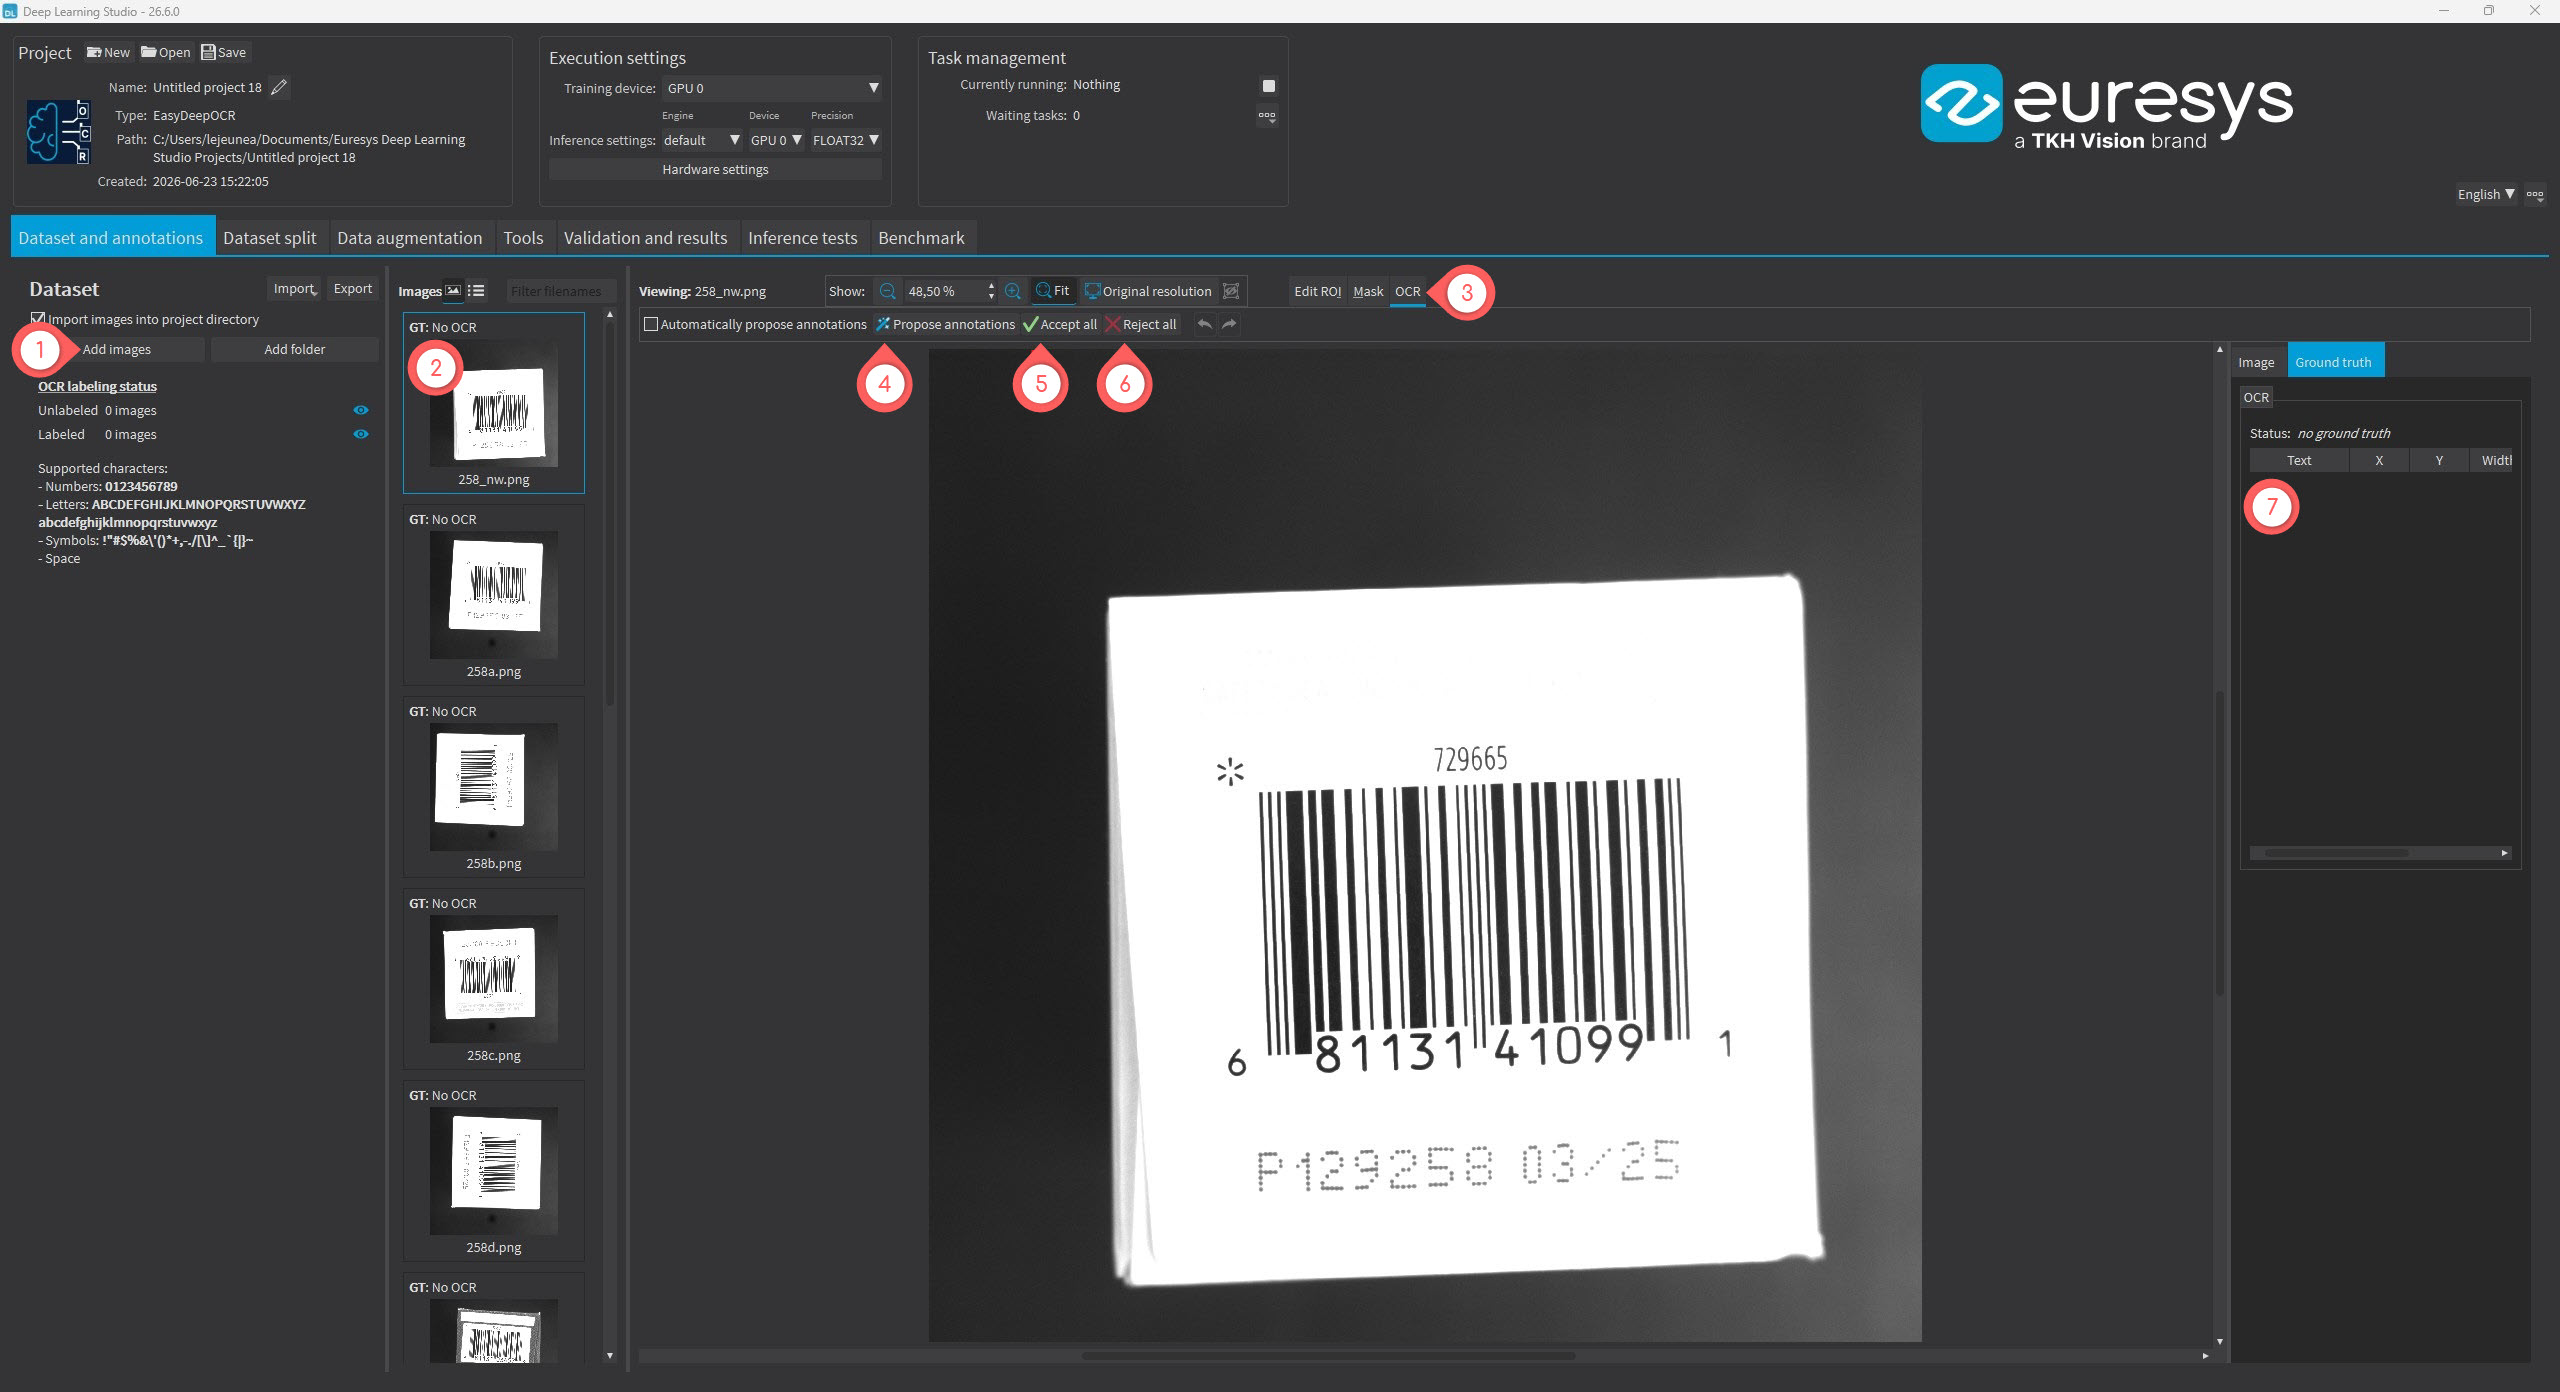
Click on the button
Add images(1) and select the images that you want to train and test with.Click on the thumbnail of an image (2) to edit its annotation (3).
To edit annotations:Click on
Propose annotations(4) to automatically propose annotations (that you must accept or reject). The proposed annotations are displayed in purple.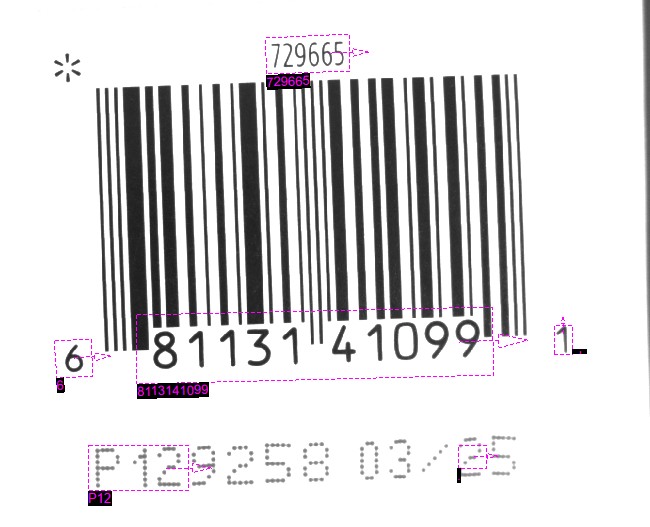
To accept or reject the proposed annotations:
Use the button
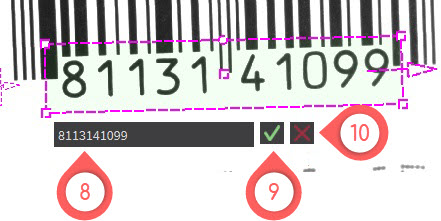
Accept all(5) orReject all(6) to accept or reject all the proposed annotations in one step.To only accept some annotations or fix these, click on an annotation to edit its geometry, its text (8), accept it (9) or reject it (10).
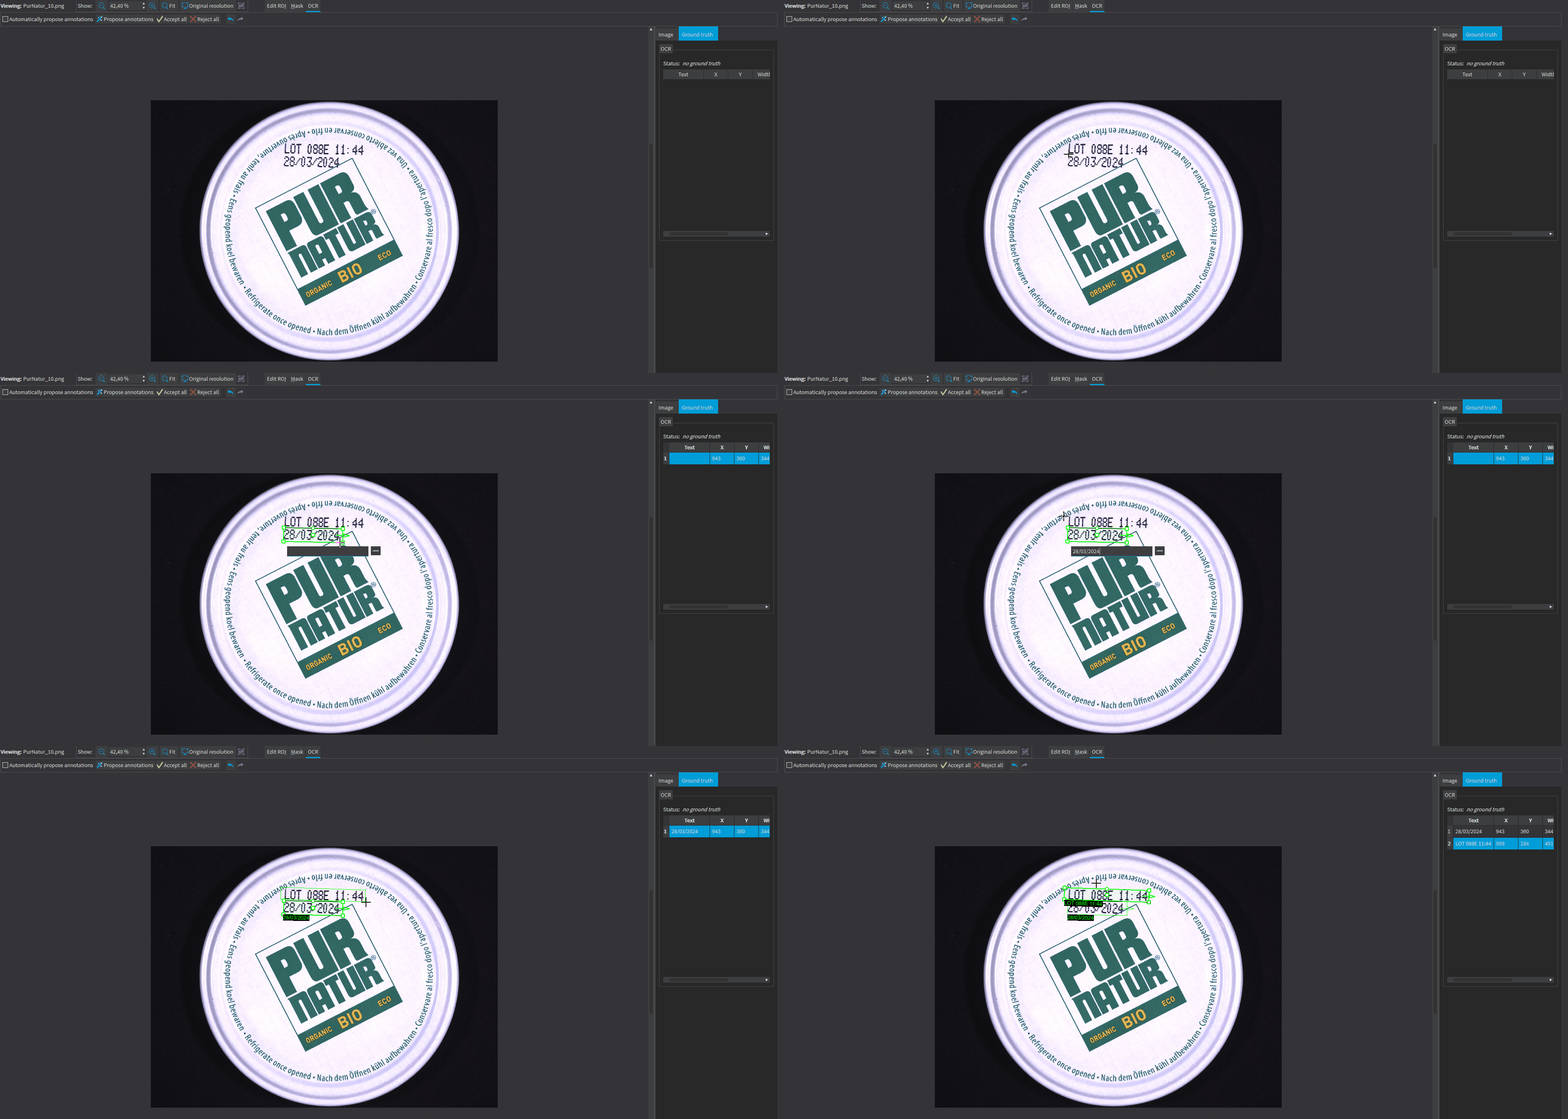
Add new annotations:
To draw the top line of the text in the direction of reading, click on the top left corner of the text and, while continuing to click on the mouse, drag it to the top right corner of the text.
Release the mouse and drag it to set the height of the text.
Write the ground truth text and press
ENTERto validate the annotation.
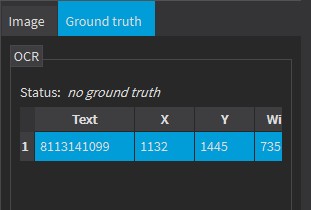
Valid annotations appear in the table (7)
Hint
To copy/paste annotations within the same image or between images, use the standard shortcuts or right-click on an annotation (image or table).
Note
If the spacing separating two texts is much bigger than a character, do not annotate this as a single text separated by a space (’ ‘) character.
Create a dataset split
By default, we recommend to use the default proportion for the split.
For very small datasets, as the validation metrics may not be accurate due to a lack of samples, do not use any validation images. However, keep a few test images to make sure that your model does not overfit.
Create data augmentation settings for your use case
Note
Shear data augmentation is not supported for the location training.
Note
Rotation and flip data augmentation are automatically disabled when training an orientation or a recognition network.
Train your tool
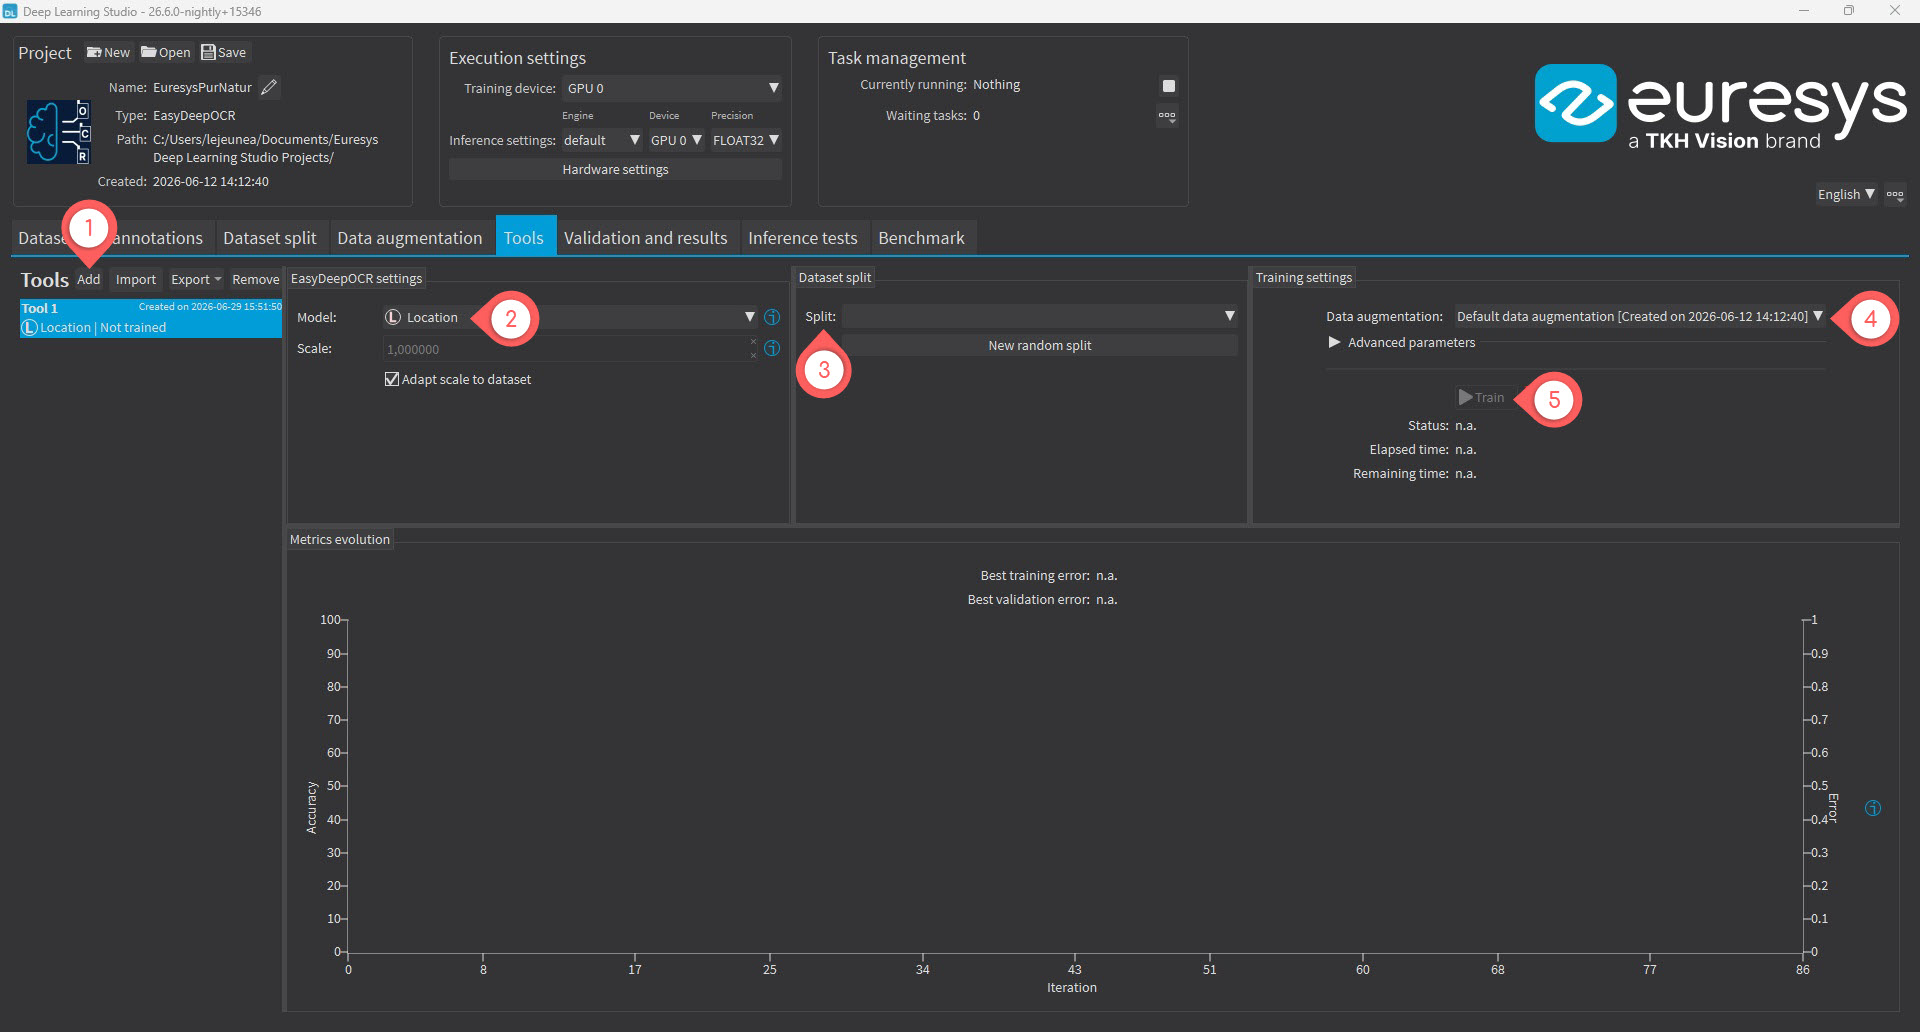
Create a new tool (1).
Select the type of model that you want to train: location, orientation or recognition (2).
Select the split (3) and data augmentation settings (4).
Train your model (5).
Evaluate your results
Location results
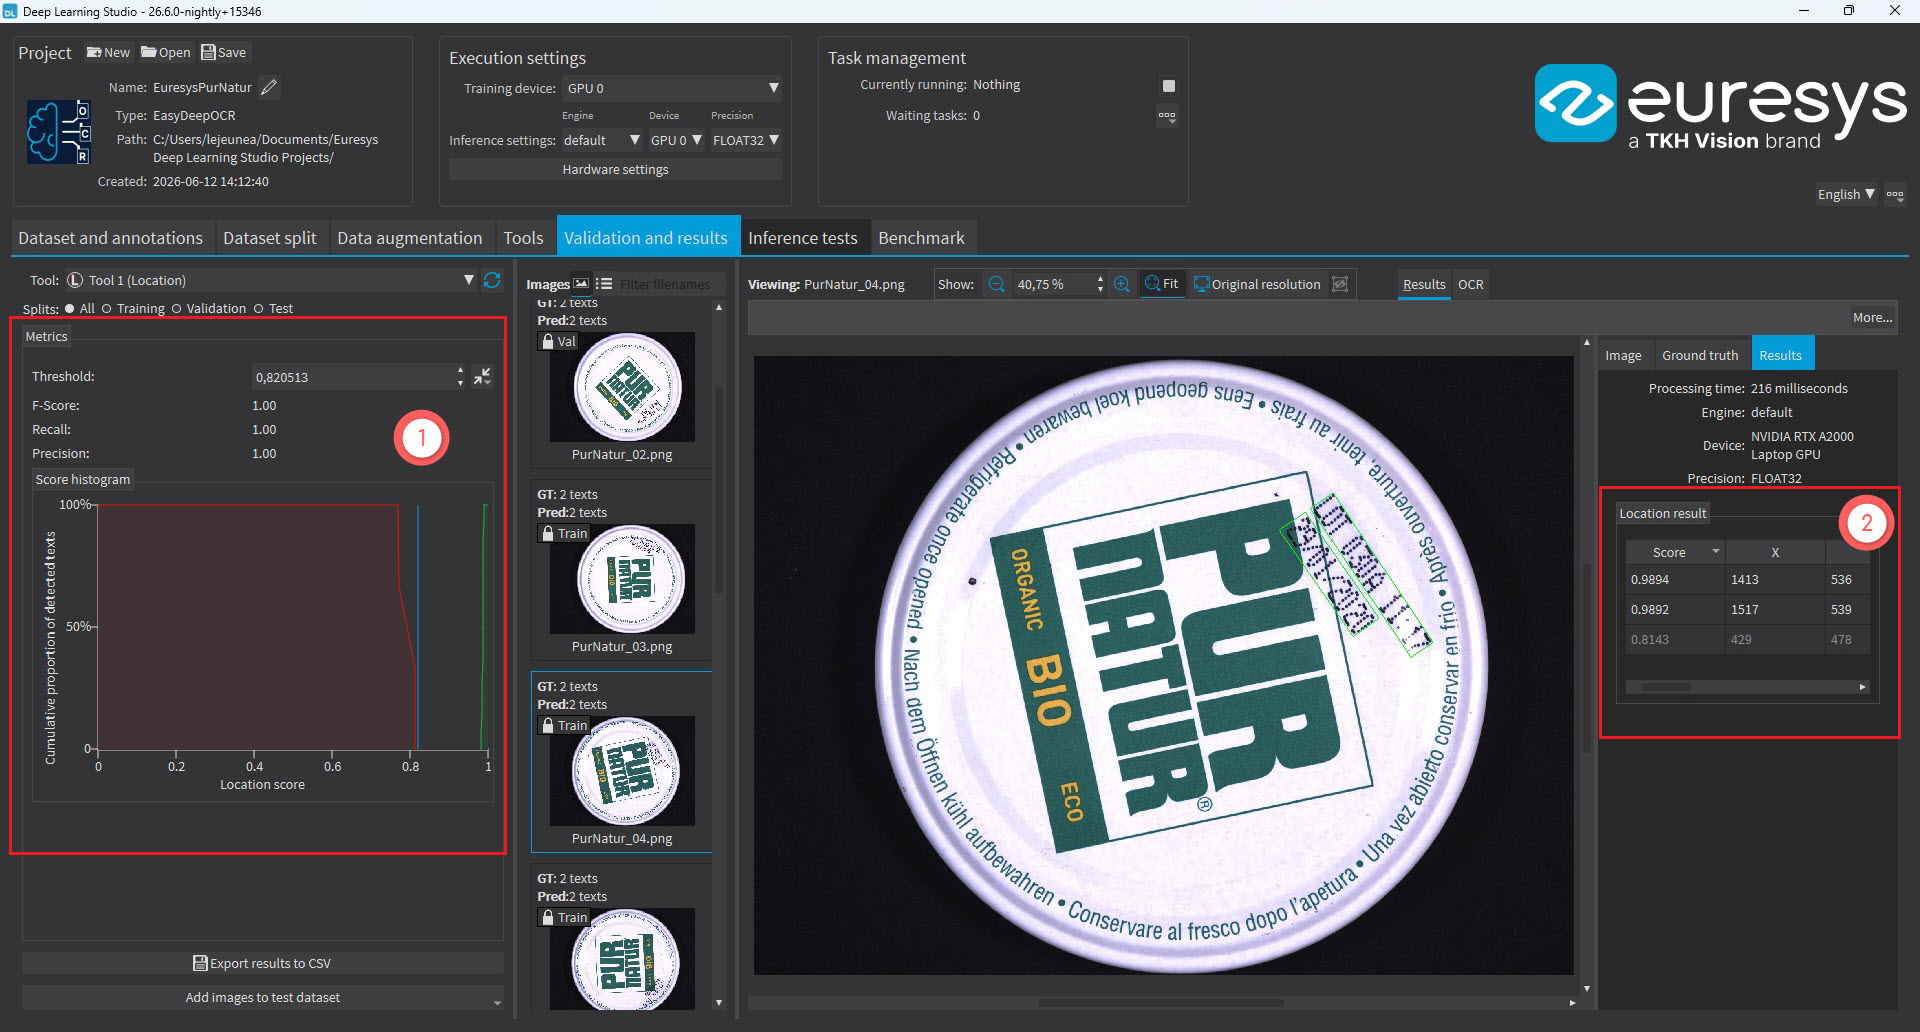
The left panel (1) displays the F-Score, the recall and the precision metrics and the score histogram of all the located texts.
The red curve in the histogram corresponds to the wrong predictions.
The green curve corresponds to the correct predictions.
The blue vertical line corresponds to the threshold.
For each image, the predictions are drawn atop the image and a list of all predictions is available in the right panel (2).
The predictions whose score are below the threshold are displayed in gray.
Orientation results
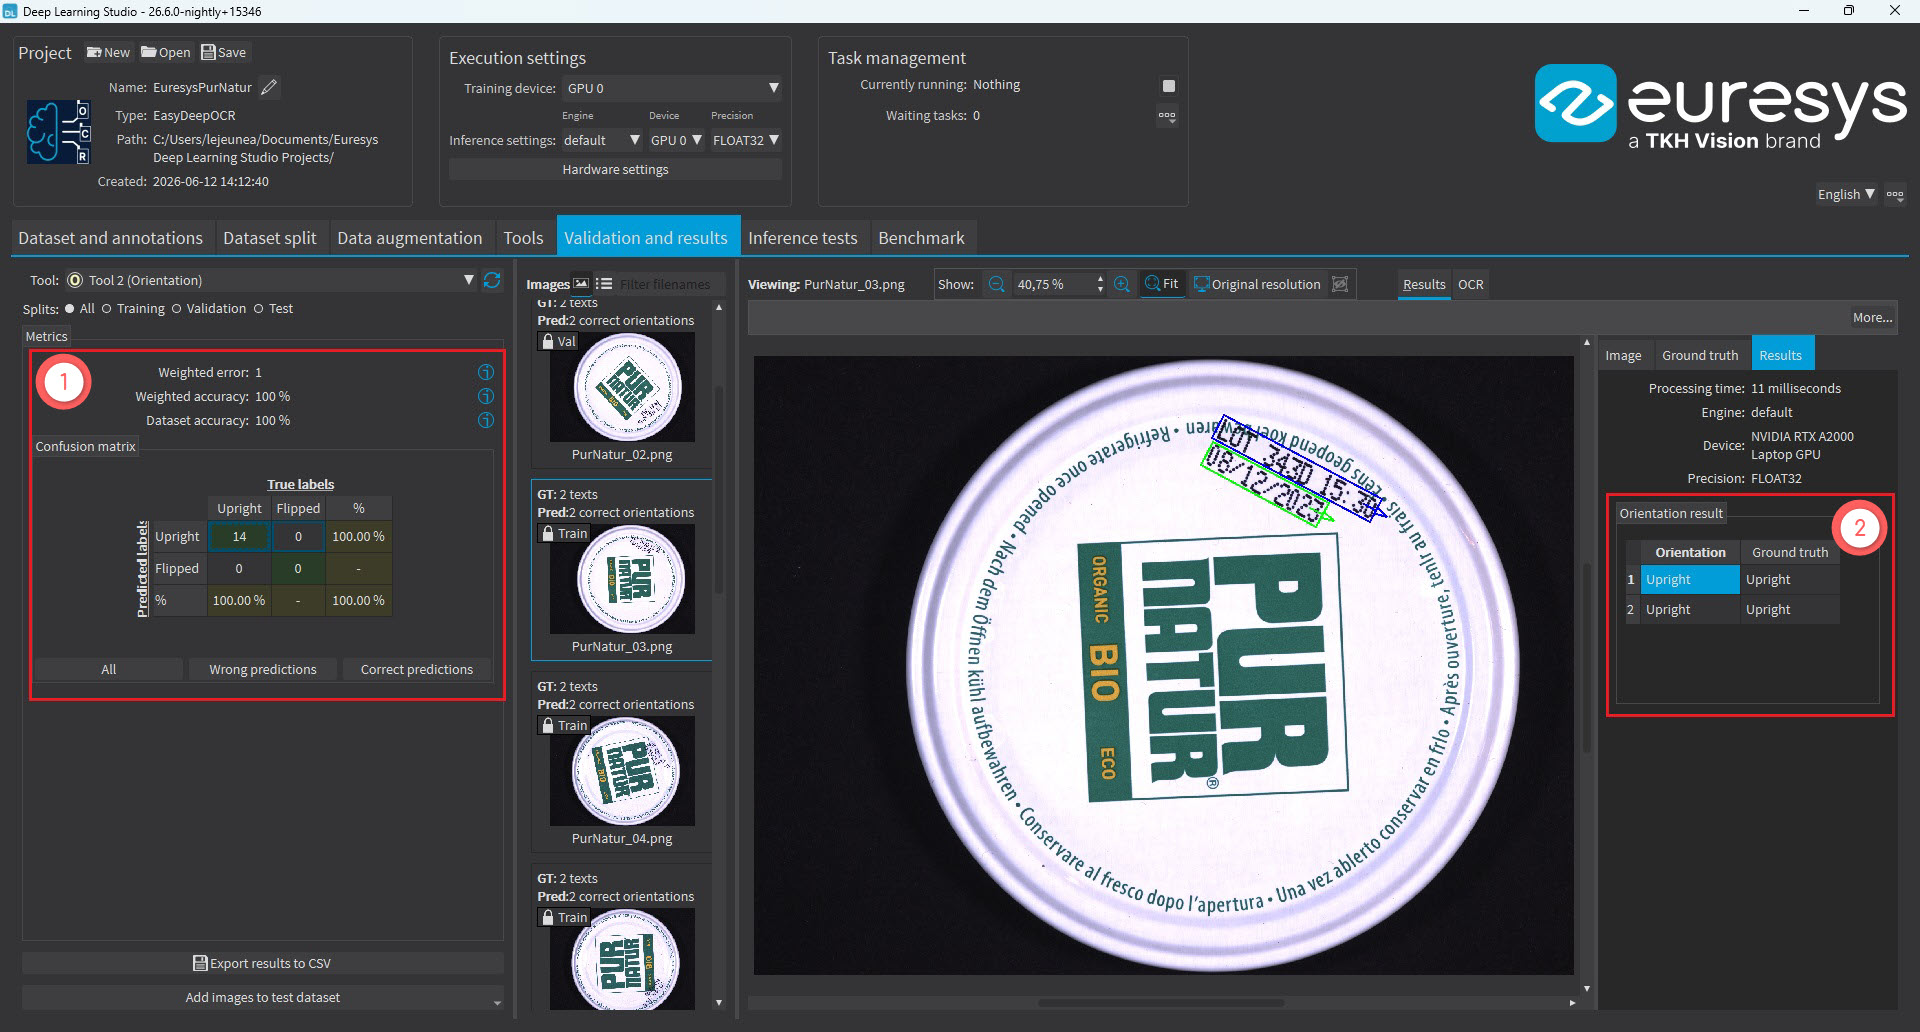
The left panel (1) displays the error, the accuracy and the confusion matrix.
For each ground truth annotation, the predicted orientation is drawn atop the image:
The correct predictions are green.
The wrong predictions are red.
The selected elements are blue.
For each ground truth annotation, the list of predictions is available in the right panel (2).
All ground truths, by definition, are always Upright.
An Upright prediction is good while a Flipped prediction is wrong.
Recognition results
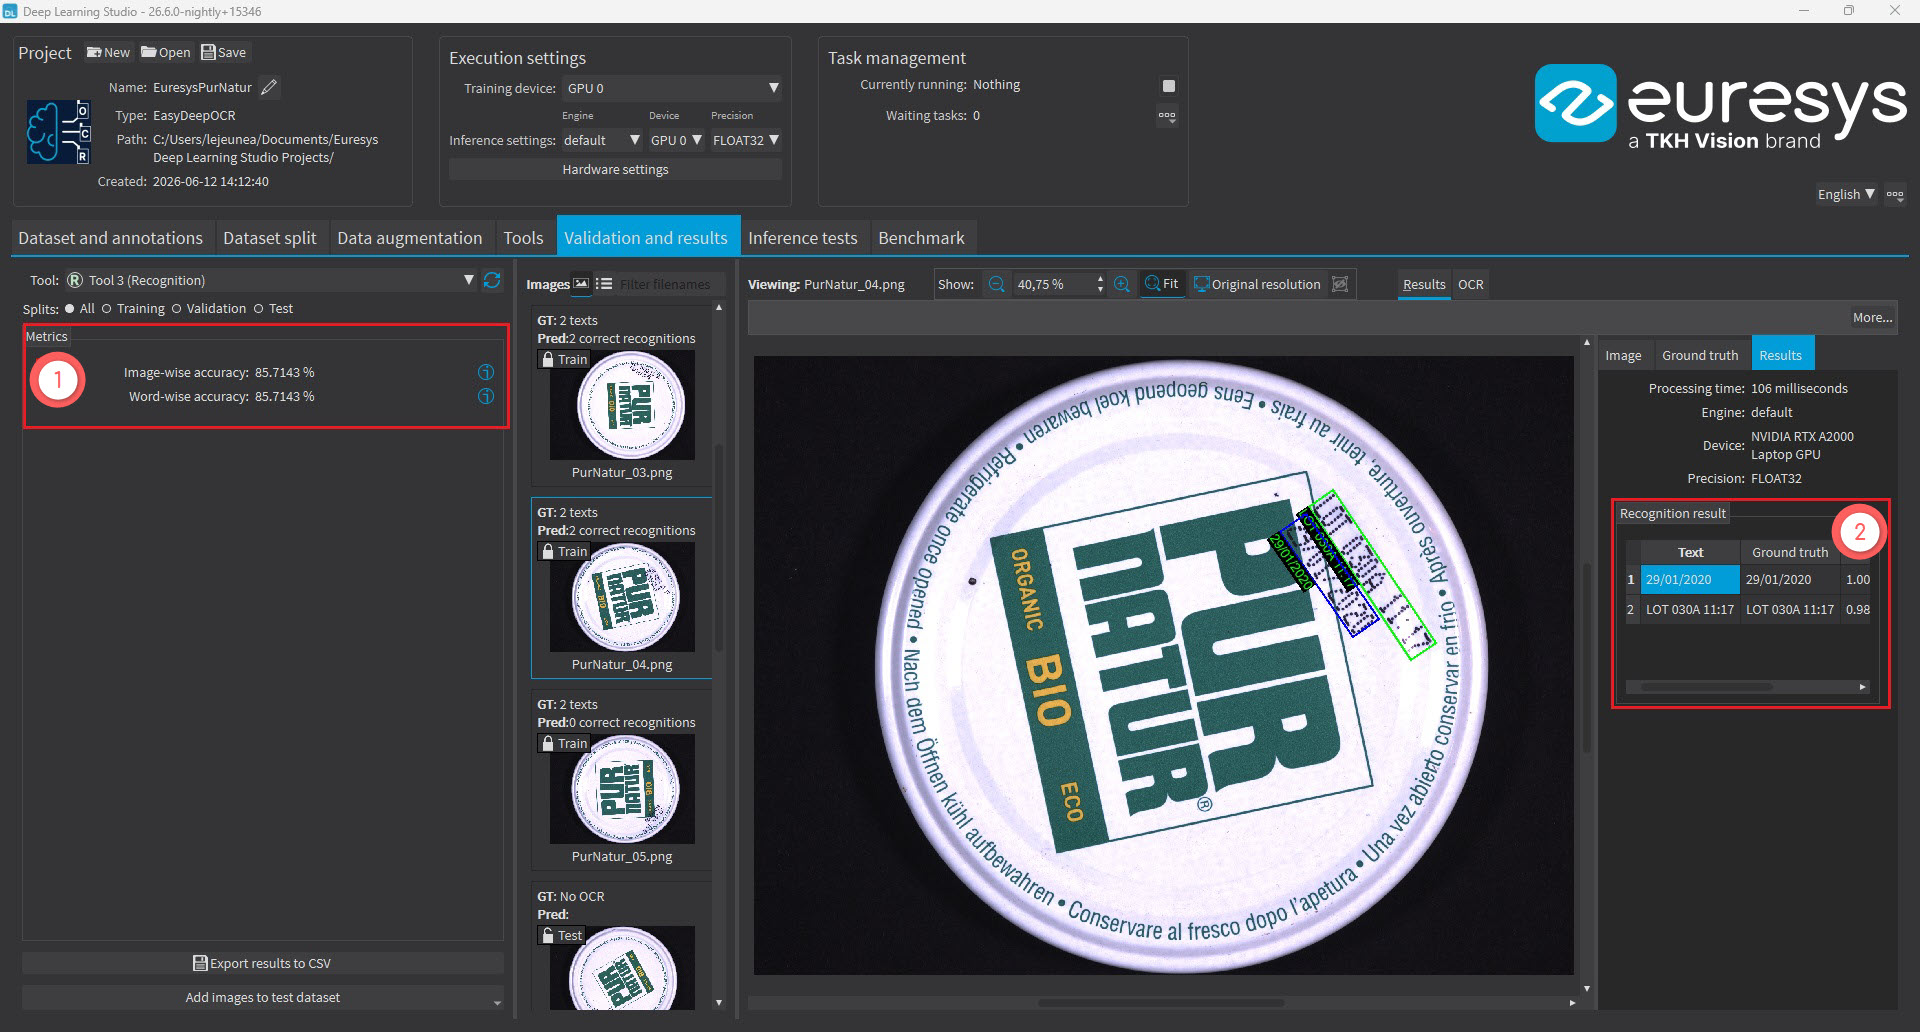
The left panel (1) displays the image-wise and word-wise accuracies.
The image-wise accuracy refers to the ratio of images in which all texts are correctly recognized.
The word-wise accuracy refers to the ratio of texts that are correctly recognized in all images.
For each ground truth annotation, the predicted text is drawn below the box of each ground truth text.
The correct predictions are green.
The wrong predictions are red.
The selected elements are blue.
For each ground truth annotation, the list of predicted texts is available in the right panel (2).
Export the tool
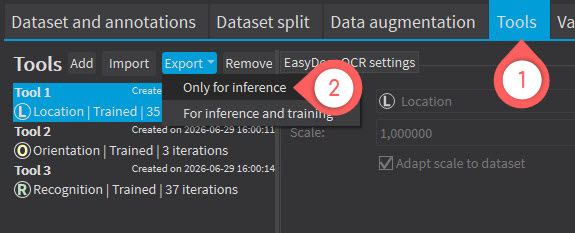
Go to the tab
Tools(1).Select the tool you want to export.
Click on Export > For Inference Only (2).
Hint
For more information about the advanced training parameters, see Deep Learning Inspection Tools.
In the API
You can train an EasyDeepOCR model with the API.
You need an EasyDeepOCR license to train a custom model with the API.
Create the dataset
Use the class
EClassificationDataset.NET Python to create and annotate your image to train the EasyDeepOCR models.Train the models
To train an EasyDeepOCR model, use the class
EDeepOCRTool.NET Python.To control the type of model that is trained, set
EDeepOCRTool::SetModel.NET Python asEDeepOCRModel_Location.NET Python,EDeepOCRModel_Orientation.NET Python orEDeepOCRModel_Recognition.NET Python.Each model has its own set of parameters:
EDeepOCRTool::SetParameters.NET Python.Currently, only the location model has parameters (in the class
EDeepOCRModelParametersTextLocation.NET Python).
Warning
An object
EDeepOCRTool.NET Python is not capable of performing an inference. Use the tool withETextReader.NET Python to perform inference.
See also
Using a Custom Model
Warning
In EasyDeepOCR, the results can be different from those in Deep Learning Studio.
This is due to several reasons:
Deep Learning Studio uses the ground truth text box as input for the orientation and the recognition models while EasyDeepOCR uses the output of the location model.
Various additional rules to handle small texts, text height and orientation hints can affect the final results.
In eVision Studio
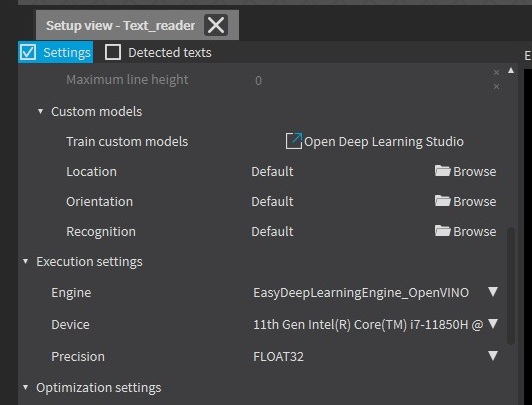
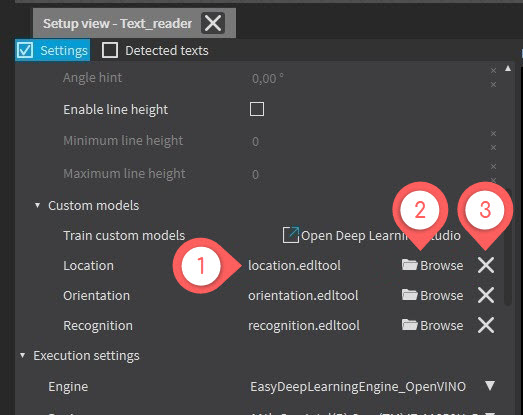
You can load the models you exported from Deep Learning Studio directly in the text reader tool of eVision Studio.
When the custom models are set to Default, it means that the default models of EasyDeepOCR are used.
Otherwise, it indicates the filename (1) that you selected when clicking on Browse (2). Use the cross button (3) to remove the custom model and use the default model again.
In the API
For each type of model, the API has:
A setter that takes the path to a saved
EDeepOCRTool.NET Python (for ex.ETextReader::SetLocationCustomModelPath.NET Python).A setter that takes an object
EDeepOCRTool.NET Python (for ex.ETextReader::SetRecognitionCustomModel.NET Python).A method to check if a custom model is set (for ex.
ETextReader::HasOrientationCustomModel.NET Python).A method to remove the custom model and use the default model (for ex.
ETextReader::ResetLocationCustomModel.NET Python).
See also