EasySegment Unsupervised
EasySegment Unsupervised is the deep learning tool part of the EasySegment segmentation library of eVision. It detects and segments defects in images.
This tool trains in an unsupervised way. This means that it is trained only with good images. So it does not require any ground truth segmentation of the defects.
To create an EasySegment Unsupervised tool:
To create an EasySegment Unsupervised project in Deep Learning Studio:
Start Deep Learning Studio.
Create a new project and select
EasySegment Unsupervisedin theNew deep learning projectdialog.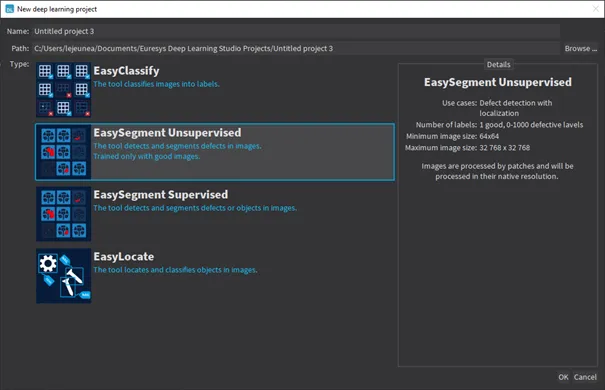
Creating an EasySegment Unsupervised project.
Properties
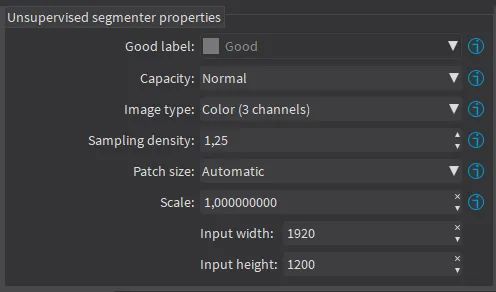
Tool properties
The unsupervised segmenter tool has 6 parameters:
The
Good labelis the name of the class that contains the good images.In the API: use
SetGoodLabel.NET Python.In Deep Learning Studio, the
Good labelis a project property that you must select in theDataset and annotationstab below the list of labels.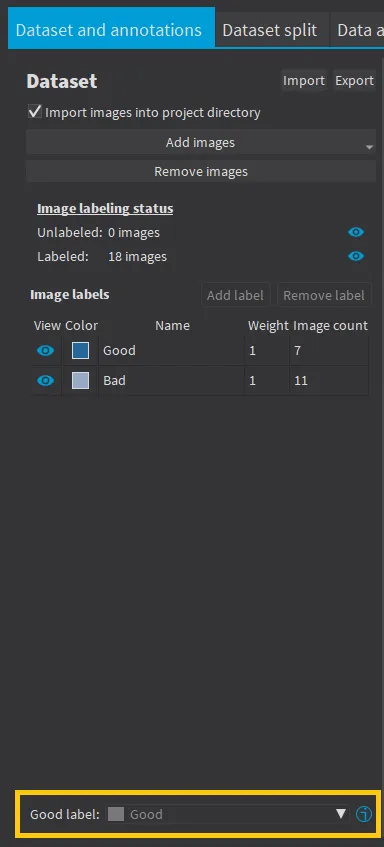
Selecting the `Good label` The
Capacityof the neural network (default:Normal) represents the quantity of information it is capable of learning. A larger capacity makes the tool slower.In the API:
The capacity is represented by the enumerate type
EUnsupervisedSegmenterCapacity.NET Python.SetCapacity.NET Python sets the capacity of the tool.
The
Image type(default:Monochrome (1 channel)):In the API:
To use monochrome (grayscale, 1 channel) images, set
SetForceGrayscale.NET Python totrue.To use color (3 channels) images, set
SetForceGrayscale.NET Python tofalse.
The
Sampling density(SetSamplingDensity.NET Python) is the parameter of the sliding window algorithm used to process whole images using patches of size (EUnsupervisedSegmenter::SetPatchSize.NET Python).It indicates how much overlap there is between the image patches: 100 - (100 /
SamplingDensity) (%)In practice, the stride between 2 consecutive patches is:
PatchSize/SampleDensity(pixels)
The
Patch size(SetPatchSize.NET Python) is the size of the patches processed by the neural network.By default, the patch size is determined automatically from the images in the training dataset.
You can also select the resolution of the patch size from the drop down list.
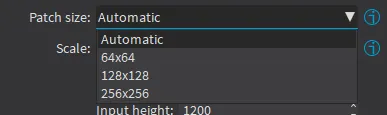
Patch sizes.
Use the
Scale(SetScale.NET Python) to automatically resize your images to a lower resolution and accelerate the processing.In Deep Learning Studio:
If the dataset contains images with different resolutions, the
Input widthand theInput heightindicate the range of the resolutions with the given scale.If all the images in the dataset have the same resolution, set either the
Input widthor theInput heightto change the scale.
Training
To train your tool, see Training a Deep Learning Tool.
Validating the Results
There are 2 types of metric for the unsupervised segmentation tool:
Unsupervised metric only uses the results of the tool on good images. There is only one unsupervised metric: the error.
Supervised metrics require both good and defective images. The supervised metrics are the AUC (Area Under ROC Curve), the ROC curve, the accuracy, the good detection rate (also called the true negative rate), the defect detection rate (also called the true positive rate).
The unsupervised segmentation tool computes a classification score .NET Python for each image. The label of a result is obtained by thresholding this score with the segmenter classification threshold .NET Python. So, the supervised metrics also depends on the value of this classification threshold.
The ROC curve (Receiver Operating Characteristic) is the plot of the defect detection rate (the true positive rate) against the rate of good images classified as defective (also called the false positive rate). It is obtained by varying the classification threshold. The ROC curve shows the possible tradeoffs between the good detection rate and the defect detection rate.
The area under the ROC curve (AUC) is independent of the chosen classification threshold and represents the overall performance of the tool. Its value is between 0 (bad performance) and 1 (perfect performance).
Deep Learning Studio
In the
Toolstab, the metricsBest validation errorandBest validation AUCare computed during the training on the validation dataset without using data augmentation. The validation error, the training error and the validation AUC are plotted for each iteration.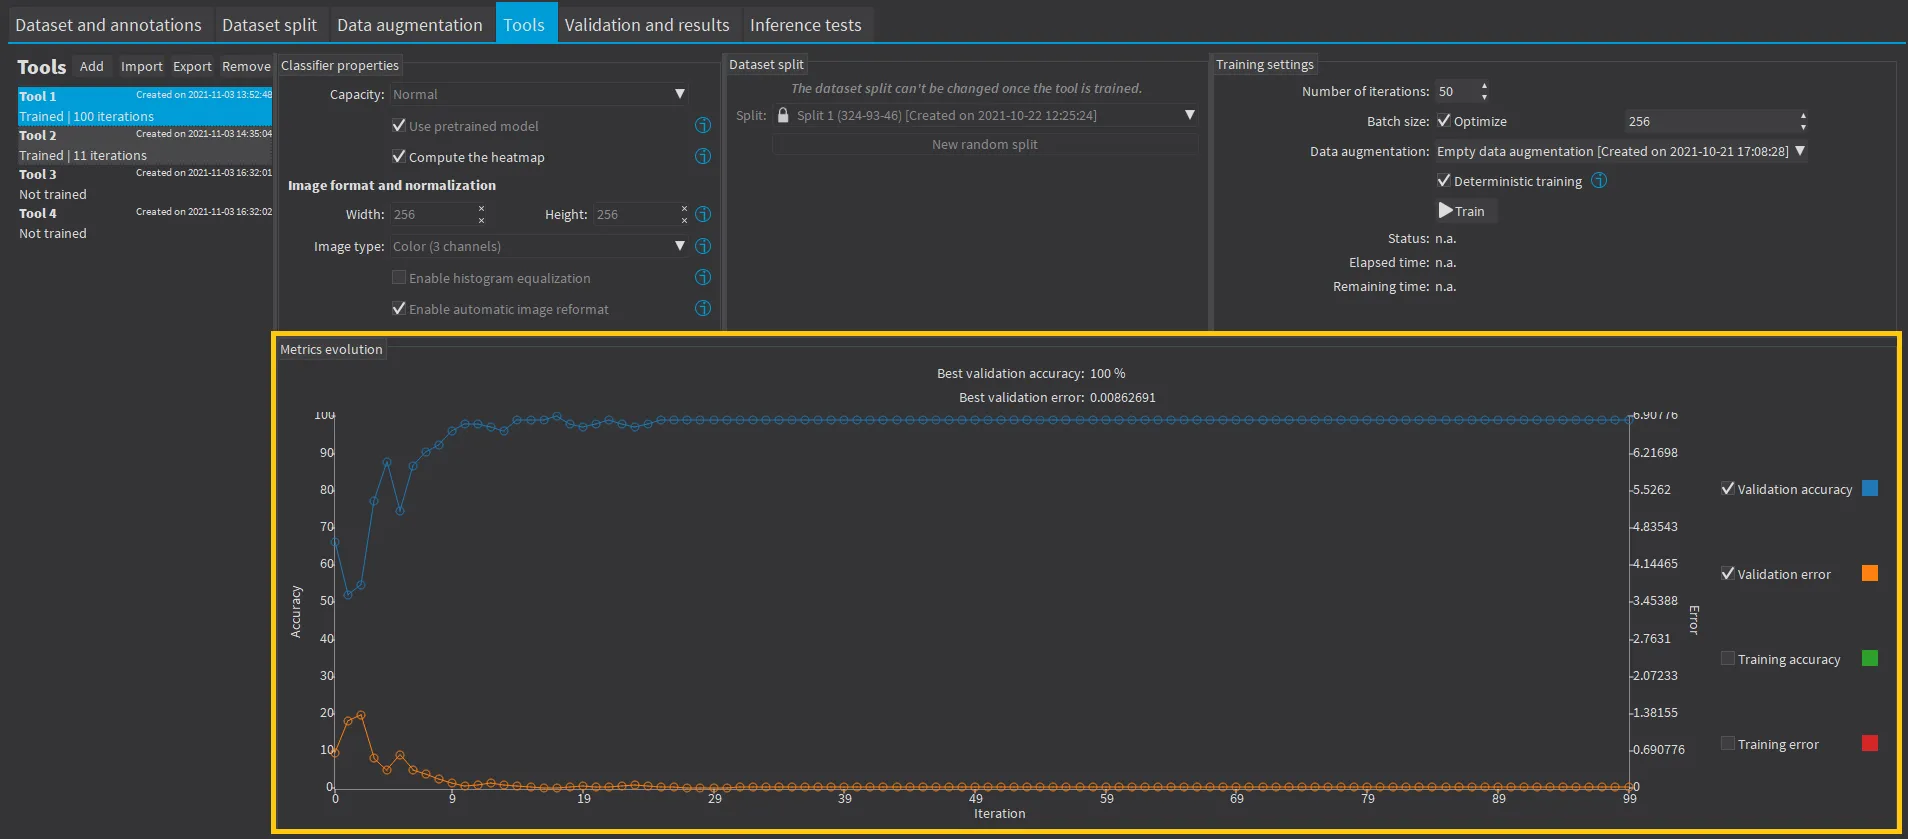
Training metrics. In the
Validation and resultstab, various metrics, the confusion matrix, a cumulative score histogram, and the ROC curve are displayed. You can also change the classification threshold directly in this tab.The cumulative score histogram shows the cumulative proportion of good (in green) and defective (in red) images with respect to the scores of the image.
You can change the classification threshold in 3 ways : direct input, dragging the threshold line in the score histogram and selecting a point on the ROC curve.
API
The metrics are represented by an
EUnsupervisedSegmenterMetrics.NET Python object that contains the following performance metrics:The confusion matrix (
GetConfusion.NET Python)If the results for bad images are included in the metrics,
IsTotallyUnsupervised.NET Python isfalseand the following metrics are also be accessible:The accuracy (
GetAccuracy.NET Python)The Area under ROC curve (
GetAreaUnderROCCurve.NET Python)The ROC point corresponding to the classification threshold (
GetROCPoint.NET Python)
Applying the Tool to New Images
Deep Learning Studio
Add new images to the dataset and refresh the results.

Refreshing or computing new results.
Open the
Inference teststab to apply the segmenter to new images and display detailed results for these images.
API
Once the unsupervised segmenter is trained, call
EUnsupervisedSegmenter::Apply.NET Python to detect and segment defects in an eVision image.This method returns a
EUnsupervisedSegmenterResult.NET Python object:IsGood.NET Python andIsDefective.NET Python returns whether the tool has decided that the image is good or defective according to theGetClassificationScore.NET Python and theEUnsupervisedSegmenter::GetClassificationThreshold.NET Python.GetSegmentationMap.NET Python returns anEImageBW8.NET Python image where all pixels with a value different than 0 are defective pixels.The value of a defective pixel is proportional to the importance of the defect at that position.
GetRegion.NET Python returns anERegionobject corresponding to the segmented region of the image (all the pixels ofGetSegmentationMap.NET Python that have a value strictly higher than 0).