3D Viewer
The class E3DViewer .NET Python is an interactive 3D viewer for point clouds, ZMaps, meshes and basic shapes (lines, planes, boxes and spheres).
It features multiple sources display, color ramps, 3D point picking and text label display.
It is compatible with Windows and Linux and can be integrated to Win32, MFC and QT frameworks.
Creating a 3D Viewer
The general constructor of a 3D viewer is:
E3DViewer(EUIAPI uiApi, int orgX, int orgY, int width, int height, void* parent)The way to use it depends on the Operating System and the User Interface API.
Windows Only
To create a 3D viewer stand-alone window:
Use
E3DViewer(EUIAP.EUIAPI_Win32, orgX, orgY, width, height)
To create a 3D viewer as a part of another window in an MFC application:
Use
E3DViewer(EUIAP.EUIAPI_Win32, orgX, orgY, width, height, handle to the parent window)See the MsVc or MsVcs Easy3DViewer sample.
Windows and Linux
To create a 3D viewer in a Qt application:
Use
E3DViewer(EUIAP.EUIAPI_Qt, orgX, orgY, width, height)You must instance the class inside a
QOpenGLWidgetobject.See the Easy3DViewer Qt sample.
Managing the Render Sources
A render source is a displayed entity. It can be an
EPointCloud.NET Python, anEZMap.NET Python, anEMesh.NET Python, anE3DBox.NET Python, anE3DLine.NET Python, anE3DPlane.NET Python or andE3DSphere.NET Python. You can display one or several render sources simultaneously in the 3D viewer.
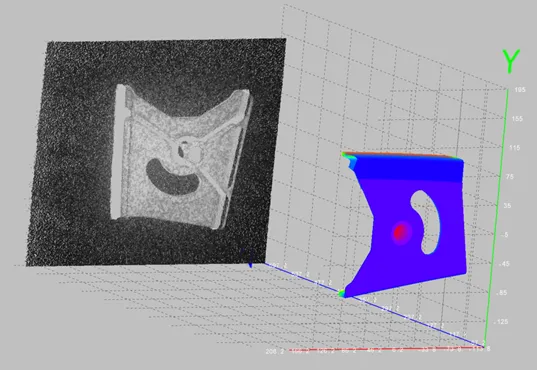
A point cloud displayed in gray scale and a mesh in false colors in the 3D viewer
To manage the list of render sources, use the methods:
E3DViewer::AddRenderSource.NET Python to add another render source to the current list. The render source has a name for further reference.E3DViewer::SetRenderSource.NET Python to change the content of the render source.E3DViewer::RemoveRenderSource.NET Python to remove a render source from the current list.
The render sources API exposes several display attributes:
Visibility (controlled by
E3DViewer::ShowRenderSource.NET Python/E3DViewer::HideRenderSource.NET Python)Color mode (
E3DViewer::SetRenderSourceColorMode.NET Python): choose between constant color (the only option for basic shapes), color ramp or point cloud color attributes.Color (
E3DViewer::SetRenderSourceConstantColor.NET Python) for render sources with constant color.Opacity (
E3DViewer::SetRenderSourceOpacity.NET Python)Point size (
E3DViewer::SetRenderSourcePointSize.NET Python): applies to point clouds and ZMaps only.Wire frame (
E3DViewer::SetRenderSourceWireFrame.NET Python): applies to meshes, boxes and planes.
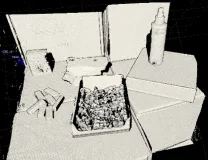 Point cloud displayed with constant color.
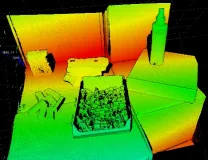 Point cloud displayed using a color ramp.
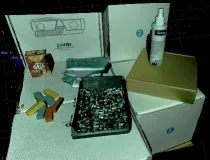 Point cloud displayed using color attributes.
Data courtesy of Zivid.
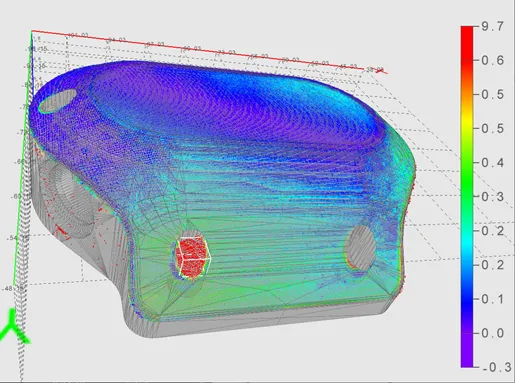
A mesh with wireframe and transparency, combined with a point cloud with color ramp
Shading
E3DViewer .NET Python can shade rendering sources using a custom version of the Eye Dome Lighting (EDL) technique.
Use
E3DViewer::SetEnableEDLShading.NET Python to enable the shading.Use
E3DViewer::SetEDLShadingFactor.NET Python to adjust the shading between 0 and 1:0 means no shading.
1 means strong shading.
EDL is a post processing technique. It impacts all opaque render sources all together. With EDL, pixels that are closer to the camera occlude neighbor pixels that are further away from the camera.
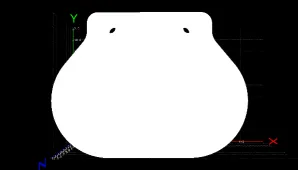 Mesh with EDL disabled.
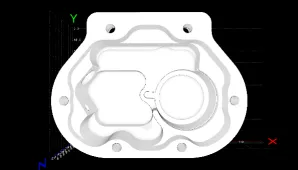 Mesh with EDL enabled.
Using a Color Ramp
When the color mode of a render source is
ESourceColorMode_Ramp.NET Python, the color of each point is calculated from the position or the attribute of the point.Use
E3DViewer::SetColorRampMode.NET Python to choose the color ramp:EColorRampMode_HueFromX.NET Python and itsYandZcounterparts compute the colors from respectively X/Y/Z point coordinates (EColorRampMode_HueFromZ.NET Python is the default color ramp mode).EColorRampMode_RGBCube.NET Python computes the colors by mixing X,Y,Z point coordinates.EColorRampMode_HueFromIntensity.NET Python computes the colors from the intensity attribute of the point.EColorRampMode_HueFromNormal.NET Python computes the colors from the normal attribute of the point.EColorRampMode_HueFromConfidence.NET Python computes the colors from the confidence attribute of the point.EColorRampMode_HueFromDistance.NET Python computes the colors from the distance attribute of the point.
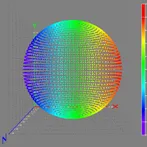 Point cloud with color map mode `Hue from X`.
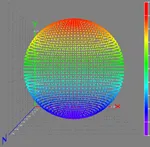 Point cloud with color map mode `Hue from Y`.
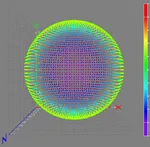 Point cloud with color map mode `Hue from Z`.
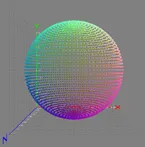 Point cloud with color map mode `RGB cube`.
When a color ramp is defined, you can display a legend at the right side of the window (default position). To control the color ramp legend aspect, use the methods
E3DViewer::ShowColorRampLegend.NET Python,E3DViewer::HideColorRampLegend.NET Python,E3DViewer::SetColorRampGraduationColor.NET Python andE3DViewer::SetColorRampLocation.NET Python.When the “Smart color ramp” is enabled with the method
E3DViewer::SetEnableSmartColorRamp.NET Python, an outlier filtering processing is applied to remove the noise and spread the colors on the main part of the object. The outliers are then displayed with constant red or blue colors.
To keep the same color ramp bounds instead of adaptive ones, use E3DViewer::SetFixColorRampBounds .NET Python.
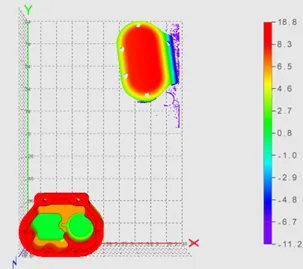
A color ramp EColorRampMode_HueFromZ .NET Python with outlier removal process. The extreme points with Z coordinate between 8.3 and 18.8 are drawn in red; the Z coordinate of 98% of the points are between -6.7 and 8.3
Interactive Controls
On Windows, the interactive controls are built in the class E3DViewer .NET Python.
The following interactions are possible:
Interaction |
Control |
|---|---|
Rotate the view |
left-click + mouse move |
Translate the view |
right-click + mouse move |
Change the view distance |
mouse wheel |
Reset the view |
r |
View along the positive / negative X axis |
x / Shift+x |
View along the positive / negative Y axis |
y / Shift+y |
View along the positive / negative Z axis |
z / Shift+z |
Show / hide the axis |
a |
Enable / disable the wireframe mode |
w |
Increase / decrease the point size |
plus sign (+) / minus sign (-) |
Use the following methods to implement custom view controls:
E3DViewer::LockRotationInitialPosition.NET Python,E3DViewer::UpdateRotationPosition.NET Python andE3DViewer::LockRotationFinalPosition.NET Python correspond to the sequence click-drag-release to change the viewpoint by rotation.E3DViewer::LockTranslationInitialPosition.NET Python,E3DViewer::UpdateTranslationPosition.NET Python andE3DViewer::LockTranslationFinalPosition.NET Python correspond to the sequence click-drag-release to change the viewpoint by translation.E3DViewer::UpdateViewDistance.NET Python changes the view distance, usually controlled by the mouse wheel.E3DViewer::ResetView.NET Python restores the default viewpoint.
You can also directly configure the view position with the methods:
E3DViewer::SetViewTarget.NET Python (by default, it is the center of the object).E3DViewer::SetViewAngle.NET Python to choose the orientation of the view.E3DViewer::SetViewDistance.NET Python to choose the distance to the view target.
See also
Sample program: Qt Easy3DViewer.
View Parameters
You can customize the 3D view and:
Change the field of view with
E3DViewer::SetFieldOfView.NET Python.Switch between the perspective and the orthographic view with
E3DViewer::SetProjectionType.NET Python.Enable or disable the display of the X, Y and Z axis with
E3DViewer::SetRenderAxis.NET Python.Switch the axis origin between the world origin and the object center with
E3DViewer::SetAxisOrigin.NET Python.Enable or disable the display of a grid with
E3DViewer::SetRenderGrid.NET Python.Activate an auto rotate animation with
E3DViewer::SetAutoRotate.NET Python.Use a decimation level (remove some points to speed up the rendering) with
E3DViewer::SetRenderDecimationLevel.NET Python.
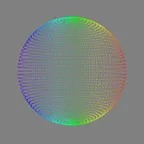 Point cloud displayed with no axis.
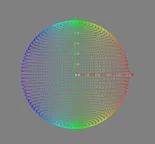 Point cloud with a world-centered axis.
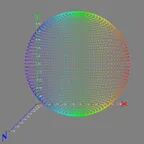 Point cloud displayed with a bounding-box axis.
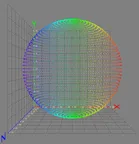 Point cloud with an axis and a grid.
Picking a 3D Point
Picking a point means detecting the point closest to the given coordinates in a
E3DViewer.NET Python window. You can then display the detected 3D point, with attributes, as a text label.
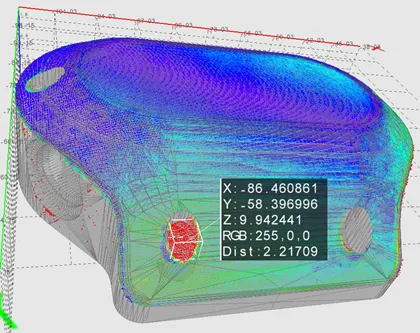
Displayed coordinates and attributes of a picked point on the 3D view
The distance threshold used to select a picked point is defined by
E3DViewer::SetPickingDistanceThreshold.NET Python. There is no picked point if the point cloud distance to the picked position is greater than this threshold.On the Win32 interface framework, the built-in control for the picking is Ctrl + mouse button.
To control the picking, use the methods
E3DViewer::Pick3DPoint.NET Python,E3DViewer::GetLastPickedPoint.NET Python andE3DViewer::ResetPicking.NET Python.To configure the
E3DViewer.NET Python to call a specified function when you pick a point, use the methodE3DViewer::SetPickedPointCallBack.NET Python.
To configure the display of the picking label, use
E3DViewer::SetPickingDisplay.NET Python,E3DViewer::SetPickingLabelSize.NET Python,E3DViewer::SetPickingLabelColor.NET Python andE3DViewer::SetPickingLabelFixed.NET Python.
Text Labels and 3D Objects
You can add custom text labels and 3D objects to the current view of the 3D viewer.
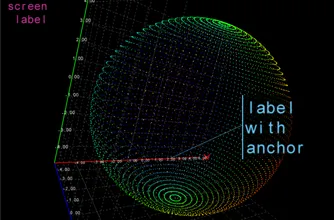
A screen label in the top left corner and a text label with 3D anchor
To control the text label display, use:
E3DViewer::AddTextLabel.NET Python to add a text label with or without a 3D anchor.E3DViewer::AddTextLabel.NET Python returns an ID used for further reference.E3DViewer::EditTextLabel.NET Python to change the position, color, size or text of a label.E3DViewer::GetTextLabel.NET Python to get the attributes of a label.E3DViewer::RemoveTextLabel.NET Python to remove a label.E3DViewer::ClearTextLabels.NET Python to remove all labels.
The class
E3DViewer.NET Python can also displayE3DObject.NET Python over a point cloud, a ZMap or a mesh. Use the tools Easy3DObject and Easy3DMatch to create theE3DObject.NET Python.Use the methods
E3DViewer::Register3DObjects.NET Python,E3DViewer::Add3DObjects.NET Python andE3DViewer::RemoveCurrent3DObjects.NET Python to manage the list ofE3DObject.NET Python that you want to display.
An E3DObject .NET Python contains several features (center point, bounding box, base plane…). Use the methods E3DViewer::ShowFeatureFor3DObject .NET Python / E3DViewer::HideFeatureFor3DObject .NET Python and E3DViewer::ShowFeatureForAll3DObjects .NET Python / E3DViewer::HideFeatureForAll3DObjects .NET Python to select the displayed features.
See the Easy3DObjectExtract MSCV sample as an example for the display of E3DObject .NET Python.
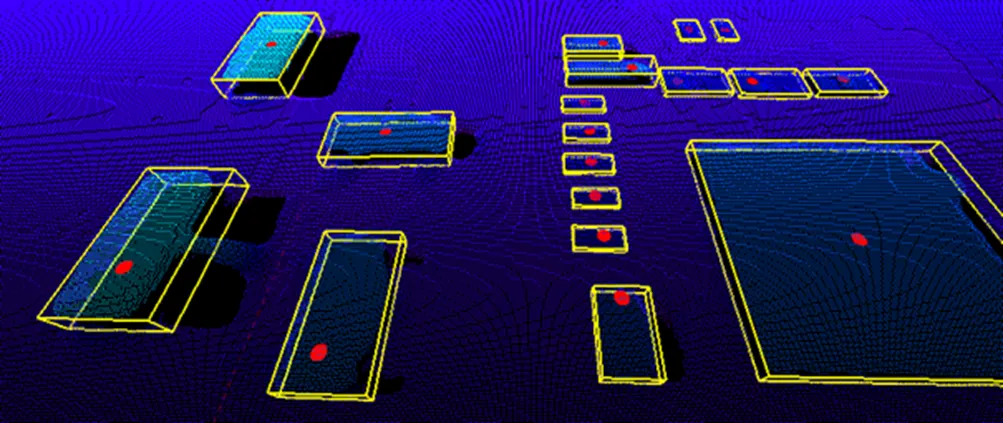
3D objects drawn with a point cloud displaying the bounding boxes and the top positions