Advanced Usage
Analyzing the Results
Use
MeasureSamplePath(n).NET Python to perform the measurement of the n-th sample path.This measurement can be useful to tune the transition measurements parameters. See the section below.
This method returns an
ESamplePath.NET Python object:Use
GetSamplePath.NET Python to get the line segment of the path.Use
GetMeasuredPoint.NET Python to get the selected measured point or useGetMeasuredPoints.NET Python to get all the measured points.Use
Plot.NET Python to plot the profile and/or the derivative of the path.
After having measured the gauge with
EBaseGauge::Measure.NET PythonUse
GetSample(n).NET Python to get the measuredsample point.NET Python of the n-th sample path. The sample point contains:Use
GetNumValidSamples.NET Python to get the number of valid sample points remaining after the model fitting operation.Use
GetAverageDistance.NET Python to get the average distance of these points to the fitted model.
Tuning the Transition Measurement Parameters for Unclear Transitions
The EasyGauge default parameters and working modes are good for clear transitions.
More complex situations may need the tuning of additional parameters. Here, we show how to tune a point gauge. However, you can apply the same method to the other gauges by analyzing their sample paths.
Set the gauge point location and tolerance.
Sets the nominal line of the point gauge. Its
center position.NET Python andorientation.NET Python are easy to decide based on a sample image or on the coordinate considerations.The
tolerance.NET Python depends on the edge position variations. A larger tolerance increases the likelihood of hitting an edge, but it may be a false edge or an extraneous feature.
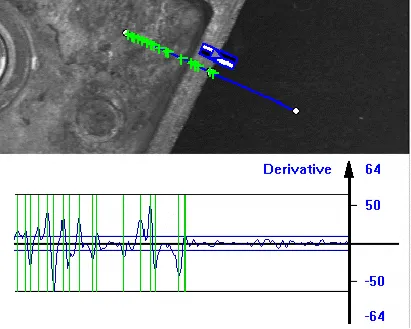
Placing the gauge.
Decide whether a noise reduction is required.
Lay the gauge over the desired location and observe the profile curve and its derivative (play with the filtering parameters while looking at the plotted curve).
The curve regularity gives an indication of the spread of the gray-level values.
When these coefficients are set, the gray-level profile will not change anymore.
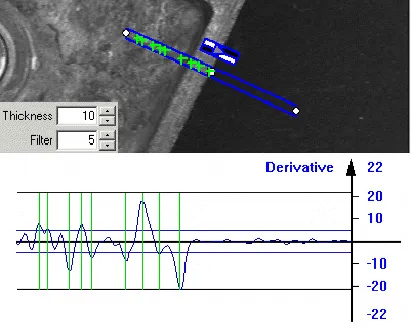
Filtering noise.
Set the threshold value.
Set a value low enough for useful parts of the peaks to cover enough pixels (to achieve better sub-pixel accuracy), but not lower than the ambient image noise.
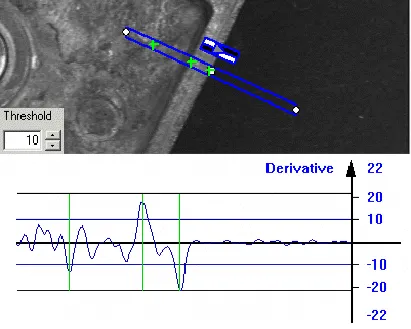
Thresholding.
Remove weak or false transitions.
Use the list of peak amplitudes and areas.
Plotting these values along with good and extraneous peaks can help find appropriate peak rejection limits.
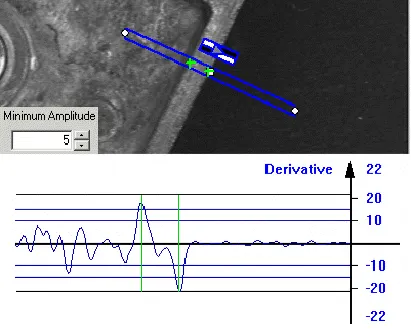
Using the amplitude and area to filter out weak or false transitions.
Choose whether all transition points are needed or just the most relevant.
If all the transition points are required, you can query them one after the other.
Otherwise, choose a point selection strategy based on the strength, the order or the transition polarity (black to white and/or conversely).
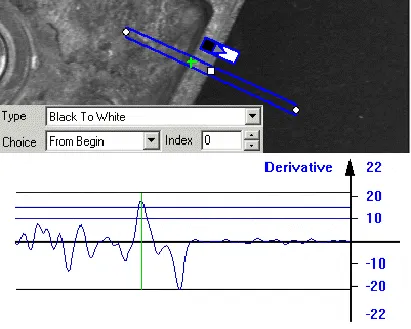
Select the relevant transition point.