Display and Graphical Manipulation
Drawing
EBaseGauge::Draw .NET Python gives a graphical representation of the gauge.
Use the enumerate EDrawingMode .NET Python to specify the parts of the gauge that you want to draw:
EDrawingMode_Nominalto draw the nominal shape, the gauge tolerances and the handles.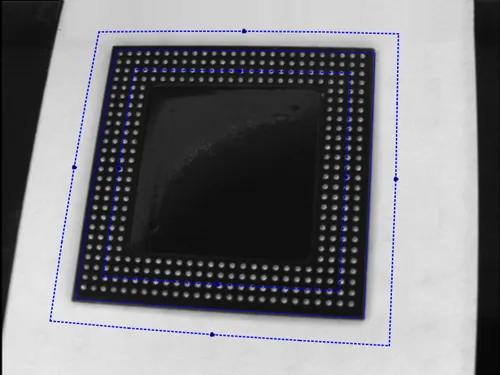
EDrawingMode_Actualto draw the measured shape.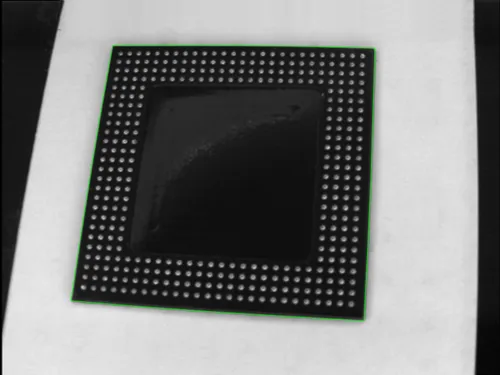
EDrawingMode_Tolerancesto draw the tolerances around the nominal shape and its handles.EDrawingMode_TransitionTypeto draw the transition type of each edge of the shape.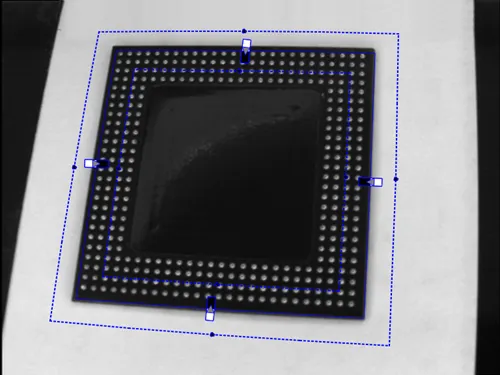
EDrawingMode_SampledPathsto draw the paths sampled along the nominal shape.EDrawingMode_SampledPointsto draw the points measured along each path sampled along the nominal shape that were used to fit the shape.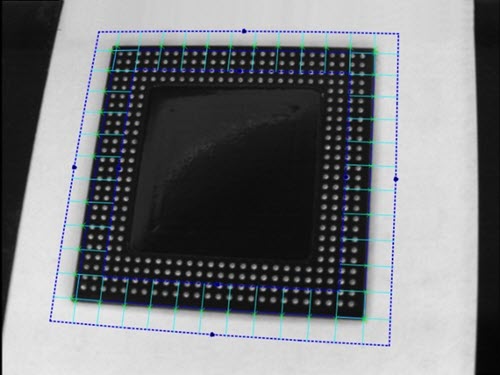
Sampled paths and sampled points
EDrawingMode_InvalidSampledPointsto draw the points measured along each path sampled along the nominal shape that were excluded from the shape fitting operation (outliers).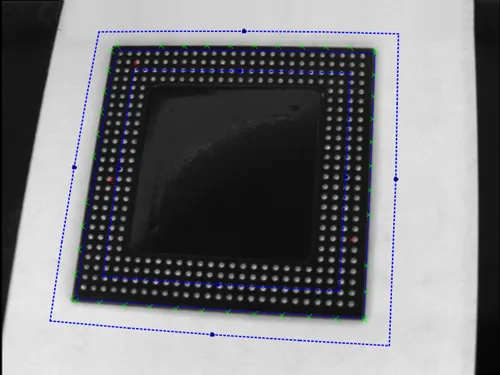
Sampled points (green) and invalid sampled points (red)
EDrawingMode_PointsInSkipRangeto draw the points in the skip ranges for the gauges that support skip ranges.
Graphical Manipulations
Use
EBaseGauge::GetAvailableEditionModes.NET Python to get the available graphical edition mode.It returns the edition modes of the underlying nominal shape and
EEditionMode_Tolerances.NET Python if the gauge has tolerances.
Use
EBaseGauge::SetEditionMode.NET Python to set the edition modes that you want to activate.Use
EBaseGauge::HitTest.NET Python to determine when the mouse cursor is over a handle and get the corresponding edition mode that you can use to change the shape of the mouse.Use
EBaseGauge::Drag.NET Python to move the handle and the corresponding gauge accordingly.
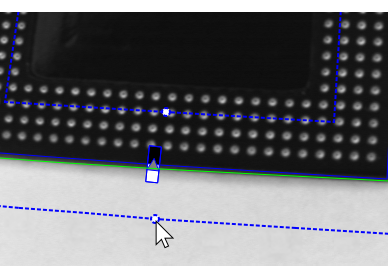
Handles for the graphical manipulation of the tolerances of the gauge.
Note
With the API, you can perform graphical manipulation on the nominal shape and on the tolerances of the gauge. However, in eVision Studio, only the tolerances can be manipulated in the gauge tools.
Plot
EasyGauge can plot gray-level values along the sample paths and/or its derivative. This is useful to tune the parameters.
Use
EBaseGauge::MeasureSamplePath.NET Python to get the measured sample path for one of the sample paths of the gauge.Use
ESamplePath::Plot.NET Python to plot the profile and/or the derivative.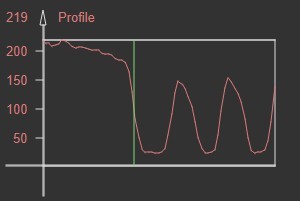
Profile of a measured sample
Use
ESamplePath::DrawPath.NET Python to draw the sample path that was measured.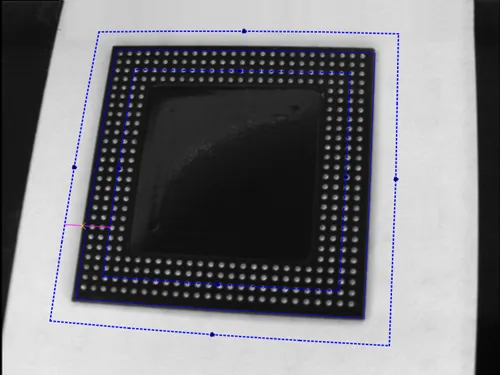
Sampled path (purple) and sampled points (yellow)
Frame
When calling the drawing and graphical manipulations methods, pass the frame in which the shape is defined.
Also pass the same frame to
EBaseGauge::Measure.NET Python.
See also
Have a look at the differences with the old legacy API of EasyGauge and how to port your application to the new API.